
Cheng JING, Hui TAO, Tong JIANG, Yanjun WANG, Jianqing ZHAI, Lige CAO, Buda SU. Population, urbanization and economic scenarios over the Belt and Road region under the Shared Socioeconomic Pathways[J]. Journal of Geographical Sciences, 2020, 30(1): 68
- Journal of Geographical Sciences
- Vol. 30, Issue 1, 68 (2020)
Abstract
Keywords
1 Introduction
The rising overall concentration of greenhouse gases caused by anthropogenic emissions constitutes the main factor contributing to global warming (
Long-term climate scenarios, the primary and most essential component of climate projections, provide possible descriptions about the future state of the world (
SSPs aim to characterize future societal and environmental changes against a reference case. They represent an important complement to quantitative model projections by describing major socioeconomic, demographic, technological, lifestyle, policy, institutional and other trends (
For each SSP, a single population (
The Belt and Road concept is an initiative for promoting inter-regional cooperation and development through trade. Future population and economic changes in the Belt and Road countries are significant to global social and economic development, since more than 60% of the world’s population and nearly half of the world’s GDP are involved (
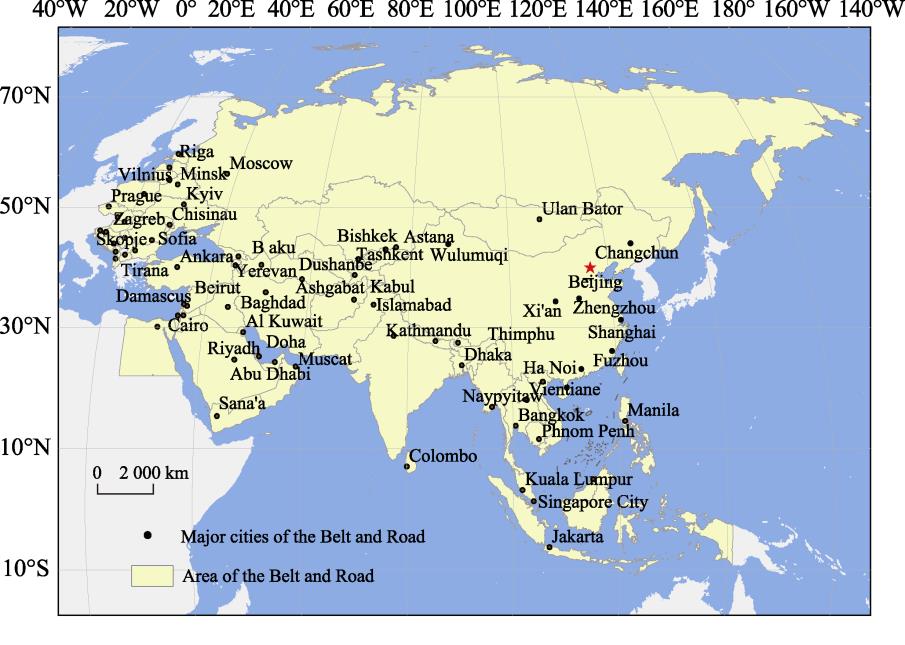
2 Study area
A total of 65 countries, including 44 Asian countries, 20 European countries and one African country, located along the Silk Road Economic Belt and the 21st century Maritime Silk Road were included in the current study (
![]()
Figure 1.
3 Materials and methods
3.1 Data
Various indicators, including the urban population, extent of urban land, or adjustments to the industrial structure, can be used to represents changes in urbanization. In this paper, the proportion of the urban population in the total population is used to represent the level of urbanization. The level of economic development level for the Belt and Road countries was quantified by their GDP. Furthermore, the purchasing power parity (PPP) was used to transform all prices into international USD and reflect the differences in the living and consumption levels among the various countries. The demographic and economic data of China during the historical period were derived from previous demographic and economic census and annual statistical yearbooks (
3.2 Population and urbanization projection model
We established projection models and parameterized them for China's population (both urban and rural) and economy. The same models were applied to all other countries in the Belt and Road region using the parameters in previous studies (
The Population-Development-Environment (PDE) model was used to produce population projections for both urban and rural areas (
The initial demographic data in China for the projection, including information on fertility, mortality, migration by age, sex, and levels of education for both urban and rural populations, are based on the 6th National Population Census in 2010. For both rural and urban populations, the fertility rate, mortality rate, migration population and education level parameters under each SSP were set separately. Meanwhile, four educational categories, namely, having no education and primary, secondary and tertiary education, were used. Transitions between neighbouring levels by age and sex result in a shift in the population between categories. The population growth, which is defined separately for each educational category, is represented by different fertility, mortality and migration rates in the model.
The assumptions for the abovementioned factors in each SSP scenario are shown in
| SSP1 | SSP2 | SSP3 | SSP4 | SSP5 | |
|---|---|---|---|---|---|
| Fertility | Low | Medium | High | Low | Low |
| Mortality | Low | Medium | High | Medium | Low |
| Migration | Medium | Medium | Low | Medium | High |
| Education | High (FT) | Medium (GET) | Low (CER) | Low (CER) | High (FT) |
| TFP growth | Medium | Medium | Low | Medium | High |
Table 1.
Assumptions of the key influencing factors on the population and economy for the SSPs
For all countries throughout the Belt and Road region except China, the values of specific parameters are established in reference to previous studies by the International Institute for Applied Systems Analysis (IIASA) (
3.2.1 Fertility
The recorded total fertility rate (TFR) in 2010 was 1.18 (0.97 and 1.44 for the urban and rural population, respectively), much less than the TFR estimated by various domestic and international demographers, which was approximately 1.45 (
Before 2014, the strong influence of the one-child policy on population growth resulted in a lower fertility rate throughout China (
Differences among the low, medium, and high fertility assumptions were based on research from the Vienna Institute of Demography (VID) (
| Year | 2010 | 2020 | 2030 | 2040 | 2050 | |
|---|---|---|---|---|---|---|
| Urban | Low | 1.19 | 1.24 | 1.29 | 1.25 | 1.21 |
| Medium | 1.19 | 1.61 | 1.61 | 1.61 | 1.61 | |
| High | 1.19 | 1.56 | 1.93 | 1.97 | 2.01 | |
| Rural | Low | 1.19 | 1.35 | 1.51 | 1.46 | 1.42 |
| Medium | 1.64 | 1.89 | 1.89 | 1.89 | 1.89 | |
| High | 1.19 | 1.61 | 1.61 | 1.61 | 1.61 | |
| Total | Low | 1.19 | 1.28 | 1.37 | 1.31 | 1.25 |
| Medium | 1.45 | 1.72 | 1.71 | 1.68 | 1.66 | |
| High | 1.19 | 1.61 | 1.61 | 1.61 | 1.61 |
Table 2.
Assumptions of total fertility rate for the urban and rural populations in China
3.2.2 Mortality
The life expectancies were calculated by examining mortality at all ages. According to census data, the life expectancies of urban inhabitants were 77.9 and 72.4 for females and males, respectively, while those of rural inhabitants were 73.9 and 70.1 for females and males.
For the medium assumption scenario, life expectancies are assumed to approach those of developed countries with a constant increase of two years per decade. For the low (high) mortality assumption, the life expectancies are assumed to increase by one year shorter (longer) than the medium scenario. Moreover, a higher level of education corresponds to a longer life expectancy, and thus, a five-year difference was assumed between population with no education and tertiary education. The difference between the population with no education and primary education is assumed to be one year, and a two-year difference is assumed for the populations with secondary and tertiary education levels (
3.2.3 Migration
The initial migration population in 2010 was calculated by census data. Most studies suggest that the migration rates for inter-provincial and urban-rural areas are slowing down due to economic growth and the narrowing of the regional development gap (
3.2.4 Education
In 2010, the enrolment ratios for primary, secondary (junior and senior high school) and tertiary (graduate and above) schools in China were 0.96, 0.93 and 0.27, respectively, based on census data. The enrolment rates for primary, secondary and tertiary education in South Korea were 1.00, 1.00 and 0.93, respectively, thereby representing high levels of enrolment. For the FT scenario, the transitions are assumed to reach high rates of enrolment by 2050 and thereafter. For the GET scenario, the transitions are assumed to reach medium rates of enrolment with values reaching 0.98, 0.96 and 0.60 by 2050, and then, will remain unchanged. For the CER scenario, the transitions will remain at the current level.
3.3 Economic model and parameters
The Cobb-Douglas model was used to produce GDP projections, and the total factor productivity, capital stock and labor input were considered as the most important factors of economic projection. The GDP in year t can be calculated by:
where G denotes the GDP, K denotes the capital stock, α is the output elasticity on capital, L is the labour input, and TFP is total factor productivity with 2010 as the initial year, K was calculated by the following equation (
where Pk denotes the price of capital and was assumed to 0.12 for all SSPs. GDP, TFP, K, L, and α in the historical period were derived from the statistical yearbook of China.
L is a function of the effective factor on labour and the actual number of workers, it can be calculated by:
where g represents different age groups: 15-64 years and 65+years, E is educational level, LFP is the labor force participation, and P is the working age population. E and P were derived from the SSP population projections in this paper. According to the data of the 6th National Population Census, the LFP rate in 2010 was 0.77 for the population aged 15-64 years and 0.19 for the population aged 65+ year, respectively. The assumptions of future LFP were based on studies from the Potsdam Institute for Climate Impact Research (PIK), and assumed to reach 0.7, 0.7, 0.6, 0.77 and 0.8 for the population aged 15-64 years under SSP1-5 respectively, and 0.15 for the population aged 65+ years under all SSPs.
TFP is the ratio of output to total factor input and was estimated by Solow model (
4 Results
4.1 Socioeconomic status in the Belt and Road region
Countries throughout the Belt and Road region exhibit dense population and thriving economy, and the overall socioeconomic level has developed rapidly over the past 30 years. The trends of the population size, urbanization level and GDP in the Belt and Road region are shown in
![]()
Figure 2.
The population size, urbanization level and GDP of each country throughout the Belt and Road region in 2016 are shown in
![]()
Figure 3.
Nearly 50% of the population in the Belt and Road countries resides in urbanized areas, and there are significant differences in the geographical distribution of the population among the different regions. In general, Central Europe and East Europe have higher urbanization levels. Most of the countries therein have urbanization rates exceeding 60%; Bulgaria is the most urbanized at 74.3%. Meanwhile, the countries in East Europe and Central Asia have vast territories with sparse populations; nevertheless, over 50% of the population in this region is concentrated in urban areas. Most countries in the Middle East rely on oil output to obtain capital, and they have a very high urbanization level (> 70%). The combined urban population of Saudi Arabia and Kuwait is > 90%. In South Asia and Southeast Asia, where the population is dense and the economy is relatively less developed, the level of urbanization is usually low; less than half of the developing countries have urban populations of about 50%, and the number is less than 20% in both Nepal and Sri Lanka.
As of 2016, the total GDP in the Belt and Road region reached 56.5 trillion USD, accounting for 47% of the total global economy. Countries located in Central Europe had a relatively large GDP per capita, but the total economy was relatively small (2.8 trillion). In contrast, the total GDP of the countries in East Europe and Central Asia was 5.2 billion USD. Russia boasted a GDP of 3.4 trillion USD, while the other countries possessed relatively small economies with less than 500 billion USD each. The economies of the countries in the Middle East were relatively high. Over half of those countries had a national GDP exceeding 500 billion USD. Developing countries are mainly distributed in South and Southeast Asia. Although the level of industrialization among these nations is relatively low, the total economic volume is large. The total GDP of the 25 countries in South and Southeast Asia in 2016 was 39.5 trillion USD, accounting for nearly 70% of the GDP in the Belt and Road region. Meanwhile, China had the highest GDP of 21.4 trillion, accounting for 37.9% of the total GDP throughout the Belt and Road region.
4.2 Population, urbanization and economic scenarios (2020-2050)
Socioeconomic scenarios of the population, urbanization and economy throughout the Belt and Road region are shown in
![]()
Figure 4.
With continuing globalization, both the urbanization and economic levels throughout the Belt and Road region will continue to increase. The proportion of the urban population to the total population will continue to grow at a rate of 1.4%-7.5%/10a. It will grow rapidly under SSP1, SSP4 and SSP5, and reach 75% by 2050 under all three pathways. The urbanization growth rate for SSP2 is moderate with an urbanization level reaching 63% in 2050. In contrast, the low level of economic development for SSP3 will lead to a relatively slow urbanization of approximately 49% in 2050.
During 2020-2050, the economy throughout the Belt and Road region will develop greatly with the GDP increasing by 2.1, 1.7, 1.1, 1.5 and 3.8 times under SSP1, SSP2, SSP3, SSP4, and SSP5, respectively, approximately 29%-56% every ten years. The economy will maintain its momentum of rapid development under SSP5 with the total GDP increasing 179 trillion and reaching 243 trillion USD by 2050, which is over double greater than that under the slowest development pathway (SSP3). SSP2 represents the pathway that will maintain the current development trend, in which the GDP will increase 108 trillion and reach 172 trillion USD by 2050. Meanwhile, SSP1 will maintain a rapid growth rate, and the GDP will increase 135 trillion and reach 200 trillion USD. For SSP4, countries will show an unbalanced economic development with the GDP more concentrated in a few countries, and the total GDP will reach approximately 160 trillion USD by 2050. The economy will be the poorest under SSP3, but it will show a continuously rising trend and reach a maximum of 134 trillion USD in 2050.
4.3 Spatial variations of socioeconomy in 2050 with relative to 2016
Compared with 2016, the proportion of the urban population in each country will change greatly. Urbanization will develop rapidly in South Asia, West Asia and Central Asia. These regions are the areas with low urbanization level at present. In the future, with the improvement of the overall economic level, the urban population accounts for more than 80% of the total population in most countries under SSP1, SSP4 and SSP5. Nepal, Cambodia and Sri Lanka will be the three countries with the fastest growing urbanization rate, and the proportion of urban population to total population will increase from about 20% to over 50%, with a growth rate of more than 160%. Under the medium pathway (SSP2), the development speed of urbanization is in the middle level. The fastest growing urbanization rate in the three countries of Nepal, Cambodia and Tajikistan will increase by 103%, 87% and 82% respectively. Under the above four pathways, the proportion of urban population to the total population will increase in all countries. The countries with the slowest growth rate have generally reached a high level of urbanization very early. Under the slowest urbanization pathway (SSP3), in most countries, the growth rate of urbanization will be less than 10%, except for some countries in Central Asia and South Asia. The fastest growing countries will be Nepal (46%), Bosnia-Herzegovina (41%) and Cambodia (33%). In Southeast Asia, such as Thailand and Indonesia, as well as Mongolia, the urbanization rate will be reduced by about 21%, 9% and 7% respectively.
With relative to the 2016 level, the GDP in most countries will be more than double in 2050 under SSP1 and SSP2. Due to the sufficient labour, South Asia, Southeast Asia and West Asia will experience the fastest economic development with their GDP generally triple in 2050, and the GDP of Timor-Leste and Syria is expected to increase tenfold. Under SSP3 and SSP4, the GDP will grow slowly, especially in Europe, Central Asia and Southeast Asia. Some countries, such as Azerbaijani and Myanmar, will even show a negative economic growth of -11% and -28%, respectively. Countries with faster growth will be in South Asia and West Asia, and increase over 8 time in Syria (1235%), Timor-Leste (977%) and Bhutan (845%). Under SSP5, the GDP in almost all countries will double the 2016 level, and economic growth will be relatively slow only in a few eastern European countries. The three countries with the fastest economic growth (Syria, Timor-Leste and Bhutan) will experience an increase of 18, 16 and 13 times, respectively, and the three countries with the slowest growth will also experience an increase of 63%, 99% and 102%, respectively. In summary, South Asia and West Asia will experience rapid growth compared with 2016, while the GDP growth will be relatively slow in Central Europe and East Europe under most of the pathways.
![]()
Figure 5.
4.4 Spatial patterns in 2050
For SSP1, the population in nearly half of the countries will reach 10 million, and India and China will be the only two countries with a population exceeding 1 billion. The urban population of almost all countries will account for over 50% of their total population, and more than 80% of the countries' urbanization rates will exceed 70%. Moreover, the economic development will be relatively fast. The GDP in 31% of the countries will exceed 1 trillion USD, while the GDP of India and China will exceed 10 trillion USD, reach 69 trillion and 55 trillion respectively.
| Countries | Population | Urbanization | GDP | |||
|---|---|---|---|---|---|---|
| Top three | Last three | Top three | Last three | Top three | Last three | |
| SSP1 | Bahrain (108%) | Moldova (-40%) | Nepal (195%) | Israel (1%) | TLS (1594%) | Azerbaijan (26%) |
| Afghanistan (75%) | Lebanon (-22%) | Cambodia (167%) | Kuwait (2%) | Syria (1505%) | Singapore (62%) | |
| ARE (72%) | Tajikistan (-19) | Sri Lanka (160%) | Lebanon (5%) | Bhutan (949%) | Kazakhstan (67%) | |
| SSP2 | Bahrain (125%) | Moldova (-39%) | Nepal (103%) | Israel (1%) | Syria (1235%) | Azerbaijan (7%) |
| Afghanistan (117%) | Lebanon (-17%) | Cambodia (87%) | Kuwait (2%) | TLS (977%) | Myanmar (40%) | |
| Yemen (105%) | Belarus (-14) | Tajikistan (82%) | Lebanon (5%) | Bhutan (845%) | Kazakhstan (47%) | |
| SSP3 | Afghanistan (164%) | Moldova (-24%) | Nepal (46%) | Thailand (-21%) | Syria (1235%) | Azerbaijan (-11%) |
| Yemen (152%) | Hungary (-22%) | BIH (41%) | Indonesia (-9%) | TLS (977%) | Myanmar (3%) | |
| TLS (143%) | Poland (-18%) | Cambodia (33%) | Mongolia (-7%) | Bhutan (845%) | Romania (18%) | |
| SSP4 | Afghanistan (153%) | Moldova (-42%) | Nepal (195%) | Israel (1%) | Syria (857%) | Myanmar (-28%) |
| Yemen (149%) | Lebanon (-23%) | Cambodia (167%) | Kuwait (2%) | Bhutan (670%) | Azerbaijan (7%) | |
| Iraq (127%) | Belarus (-20%) | Sri Lanka (160%) | Lebanon (5%) | TLS (442%) | Romania (47%) | |
| SSP5 | Bahrain (144%) | Moldova (-50%) | Nepal (195%) | Israel (1%) | Syria (1888%) | Azerbaijan (63%) |
| Israel (103%) | Tajikistan (-38%) | Cambodia (167%) | Kuwait (2%) | TLS (1621%) | Singapore (99%) | |
| ARE (101%) | Georgia (-27%) | Sri Lanka (160%) | Lebanon (5%) | Bhutan (1265%) | Lithuania (102%) | |
Table 3.
Three countries with the fastest and slowest growth in 2050 with relative to 2016
![]()
Figure 6.
For SSP2, the current development trend will be maintained. The demographic and economic development levels are projected to be similar to those for SSP1 in 2050, but the urbanization level will be lower. The urban population in all countries will exceed 30%, and in half of the countries throughout will reach 70%.
For SSP3, the populations in half of the Belt and Road countries will exceed 10 million, and in the most populous country (India) will exceed 1.9 billion. Urbanization will develop slowly with an urban population of more than 70% in only 40% of the countries. The urban population in Sri Lanka will be the lowest with urbanization level of about 23%. The urban population will exceed 90% in 8 countries. Economic development will also proceed slowly. The GDP of only 27% of the countries will be more than 1 trillion USD. Amongst, the GDP in China and India will far exceed 10 trillion with maxima of 54.5 trillion and 28.2 trillion, respectively.
Similar to SSP1, the population growth will be relatively low for SSP4, but urbanization will rapidly develop. The GDP in 30% of the countries will exceed 1 trillion USD.
Under SSP5, the population distribution will similar to SSP1. The urbanization and economic levels will develop rapidly. The GDP in approximately 38% of countries will exceed 1 trillion USD, and in 4 countries, including China, India, Russian and Indonesia, will exceed 10 trillion USD. China and India are expected to have a GDP exceeding 50 trillion USD and reach 77 trillion and 69 trillion USD, respectively.
5 Conclusions and discussion
5.1 Conclusions
Since The Belt and Road Initiative was proposed, it has attracted international attention. There are substantial socioeconomic differences between the Belt and Road countries, and thus, the selection of climate scenarios will significantly influence their future social and economic development. We therefore evaluate the spatial distribution and evolution of the projected population, urbanization and economic levels for 2020-2050 for the Belt and Road countries using five SSPs from the IPCC, namely, sustainability (SSP1), middle of the road (SSP2), regional rivalry (SSP3), inequality (SSP4) and fossil-fuelled development (SSP5). The following conclusions can be reached.
(1) The urban population in the Belt and Road countries nearly double from 1.1 billion to 2.2 billion during 1990-2016, but almost no change in their rural population. This led to a 15% increase in the level of urbanization. Simultaneously, the total GDP increased by 5.8 times from 8 trillion to 57 trillion USD. In 2016, the urban population accounts for 50% of the total population of the Belt and Road region. The countries along the 21st century Maritime Silk Road are densely populated; yet, their levels of economic and urban development were relatively low. However, countries along the Silk Road Economic Belt exhibited opposite characteristics.
(2) From 2020 to 2050, the levels of urbanization and economic development will increase greatly in the Belt and Road region under the various pathways. The average rate of urbanization will increase by 1.4%-7.5%/10a, and reach 49%-75% under the five pathways. The GDP will increase by approximately 17%-34% every ten years. By 2050, the total GDP in the Belt and Road region will reach 134-243 trillion USD. The growth of the total population will be relatively slow, with an average of only 2%-8% per decade, and reach 5.0-6.0 billion in 2050.
(3) Under the sustainable SSP1 and economic development-oriented SSP5 pathways, the urbanization and economy will develop rapidly but with less population growth. Under SSP2, social and economic development indicators will maintain their current trends at a moderate level. Under the unbalanced pathway of SSP4, the population and economy will grow slowly, but urbanization will develop rapidly. Under SSP3 characterized by regional competition, the population growth will be rapid, but the economic development and urbanization will be relatively slow.
(4) With relative to 2016, the populations will increase in most countries in 2050, and especially obvious in Central Asia and the Middle East countries. The growth will more than double in Bahrain, Afghanistan and Yemen. The economy will develop rapidly in South Asia, Southeast Asia and West Asia, and increase by more than 10 times in Timor-Leste, Syria and Bhutan. However, the economy will grow relatively slowly in Central Europe and East Europe under most of the pathways. The trend of urbanization will be similar to that of the economy. The urbanization in South Asia, West Asia and Central Asia will develop rapidly and increase by more than 150% in Nepal, Cambodia and Sri Lanka.
5.2 Discussion
In consideration of policy interventions and new parameters from the latest 2010 population census, this study first projects the population, urbanization and economic levels in China and then investigates the situation in the Belt and Road region under five different SSPs. This is the first time that newly implemented policy and census data are used in socioeconomic projections extending to 2050. Accordingly, updated information and credible population scenarios allow us to produce projections that are more realistic.
The accuracy of the population projection is the basis of further economic and urbanization projections. For different countries, future fertility rates constitute the key factor in reliably projecting the population growth. Due to various uncertain determinants (e.g., urbanization and education) of the fertility rate, the populations projected using simple assumptions of the total fertility or using relatively complex total fertility rates obtained by a combination of urban and rural fertilities might overestimate the population (
The Belt and Road region will exhibit a varying socioeconomic status in the future, and as a result, the selection of different SSPs will likely bring about completely different results. Different SSPs provide a framework for developing new socioeconomic scenarios. They can be used for not only global climate change studies but also assessments of the development of broader sustainability. This article does not present a optimistic option for future development, but rather, simply represent future possibilities and provide appropriate references for decision makers once the situation changes. The setting of five different pathways is conducive to reduce the uncertainty in socioeconomic projection. It is obviously better than the projection with single scenario.
The SSP-based socioeconomic projections are closely related to climate change. In the upcoming IPCC sixth assessment report (AR6), SSPs will be combined with RCPs to develop new scenarios for comprehensively assessing climate change and human activities. Many forthcoming studies are expected to associate the socioeconomic scenarios in the Belt and Road region with risk assessments of climate and weather disasters.
References
[1] W Arnell N, B Lloyd-Hughes. The global-scale impacts of climate change on water resources and flooding under new climate and socio-economic scenarios. Climatic Change, 122, 127-140(2014).
[2] S Basten, T Sobotka, K Zeman. Future Fertility in Low Fertility Countries. Vienna: Vienna Institute of. Demography Working Papers.(2013).
[3] M Bell, E Charles-Edwards, P Ueffing et al. Internal migration and development: Comparing migration intensities around the world. Population, Space and Place, 41, 33-58(2015).
[4] W Cai, S Borlace, M Lengaigne et al. Increasing frequency of extreme El Niño events due to greenhouse warming. Nature Climate Change, 4, 111-116(2014).
[5] H Chen, Y Zhang. Sensitivity experiments of impacts of large-scale urbanization in East China on East Asian winter monsoon. Chinese Science Bulletin, 58, 809-815(2012).
[6] F Cogliano J. Climate change and international trade. Eastern Economic Journal, 42, 159-161(2016).
[7] C Cuaresma J. Income projections for climate change research: A framework based on human capital dynamics. Global Environmental Change, 42, 226-236(2017).
[8] R Dellink, J Chateau, E Lanzi et al. Long-term economic growth projections in the Shared Socioeconomic Pathways. Global Environmental Change, 42, 200-214(2017).
[9] G Donat M, L Lowry A, V Alexander L et al. More extreme precipitation in the world’s dry and wet regions. Nature Climate Change, 6, 508-513(2016).
[10] B Field C, V Barros, F Stocker T et al. Managing the Risks of Extreme Events and Disasters to Advance Climate Change Adaptation: Special Report of the Tntergovernmental Panel on Climate Change(2012).
[11] S Fujimori, M Kainuma, T Masui et al. The effectiveness of energy service demand reduction: A scenario analysis of global climate change mitigation. Energy Policy, 75, 379-391(2014).
[12] A Goujon. Population and Education Prospects in the Arab Region.(2002).
[13] A Goujon, H Alkitkat, W Lutz et al. Population and Human Capital Growth in Egypt: Projections for Governorates to 2051. Laxenburg: International Institute for Applied Systems Analysis.(2007).
[14] A Goujon, R Fuchs. The Future Fertility of High Fertility Countries: A Model Incorporating Expert Arguments. Laxenburg: International Institute for. Applied Systems Analysis.(2013).
[15] A Goujon, K McNay. Projecting the educational composition of the population of India: Selected state-level perspectives. Applied Population and Policy, 1, 25-35(2003).
[16] A Goujon, C Samir K. Past and Future of Human Capital in Southeast Asia: From 1970 to 2030. Vienna: Vienna Institute of. Demography Working Papers.(2006).
[17] G Hansen, D Stone. Assessing the observed impact of anthropogenic climate change. Nature Climate Change, 6, 532-537(2015).
[18] J Hawksworth. How big will the major emerging market economies get and how can the OECD compete. Pricewaterhouse Coopers.(2006).
[19] H Hegre, H Buhaug, V Calvin K et al. Forecasting civil conflict along the shared socioeconomic pathways. Environmental Research Letters, 11, 054002(2016).
[20] . Climate Change 2013: The Physical Science Basis. Contribution of Working Group I to the Fifth Assessment Report of the Intergovernmental Panel on Climate Change, 1535(2013).
[21] L Jiang, C O’Neill B. Global urbanization projections for the Shared Socioeconomic Pathways. Global Environmental Change, 42, 193-199(2017).
[22] T Jiang, J Wang Y, J Yuan S et al. Projection of population and economy in the Belt and Road countries (2020-2060). Climate Change Research, 14, 155-164(2018).
[23] T Jiang, J Zhao, G Cao L et al. Projection of national and provincial economy under the Shared Socioeconomic Pathways in China. Climate Change Research, 14, 50-58(2018).
[24] T Jiang, J Zhao, C Jing et al. National and provincial population projected to 2100 under the Shared Socioeconomic Pathways in China. Climate Change Research, 13, 128-137(2017).
[25] R Jones, A Patwardan, S Cohen et al. Foundations for Decision Making, 195-228(2014).
[26] N Kaldor. Capital accumulation and economic growth. In: Lukz, Hague (eds). The Theory of Capital(1961).
[27] S Kc, W Lutz. Demographic scenarios by age, sex and education corresponding to the SSP narratives. Population and Environment, 35, 243-260(2014).
[28] S Kc, W Lutz. The human core of the shared socioeconomic pathways: Population scenarios by age, sex and level of education for all countries to 2100. Global Environmental Change, 42, 181-192(2017).
[29] S Kc, M Potancokova, R Bauer et al. Summary of Data, Assumptions and Methods for New Wittgenstein Centre for Demography and Global Human Capital (WIC) Population Projections by Age, Sex and Level of Education for 195 Countries to 2100. Laxenburg: International Institute for. Applied Systems Analysis.(2013).
[30] E Kriegler, J Edmonds, S Hallegatte et al. A new scenario framework for climate change research: The concept of shared climate policy assumptions. Climatic Change, 122, 401-414(2014).
[31] J Leggett, J Pepper W, J Swart R. Emissions scenarios for the IPCC: An update. In: IPCC. Climate Change 1992: The Supplementary Report to the IPCC Scientific Assessment, 69-95(1992).
[32] M Leimbach, E Kriegler, N Roming et al. Future growth patterns of world regions - A GDP scenario approach. Global Environmental Change, 42, 215-225(2017).
[33] W Lutz, W Butz, S Kc et al. Population growth: Peak probability. Science, 346, 561(2014).
[34] W Lutz, A Goujon. The world’s changing human capital stock: Multi-state population projections by educational attainment. Population and Development Review, 27, 323-339(2001).
[35] M Mogollón J, L Lassaletta, W Beusen A H et al. Assessing future reactive nitrogen inputs into global croplands based on the shared socioeconomic pathways. Environmental Research Letters, 13, 044008(2018).
[36] H Moss R, A Edmonds J, A Hibbard K et al. The next generation of scenarios for climate change research and assessment. Nature, 463, 747-756(2010).
[37] N Nakicenovic, P Kolp, K Riahi et al. Assessment of emissions scenarios revisited. Environmental Economics and Policy Studies, 7, 137-173(2006).
[38] N Nakicenovic, R Swart. Emission Scenarios IPCC Special Report on Emission Scenarios, 598(2000).
[39] . China Statistical Yearbook 2010.(2010).
[40] C O’Neill B, E Kriegler, L Ebi K et al. The roads ahead: Narratives for shared socioeconomic pathways describing world futures in the 21st century. Global Environmental Change, 42, 169-180(2017).
[41] C O’Neill B, E Kriegler, K Riahi et al. A new scenario framework for climate change research: the concept of shared socioeconomic pathways. Climatic Change, 122, 387-400(2014).
[42] A Popp, K Calvin, S Fujimori et al. Land-use futures in the shared socio-economic pathways. Global Environmental Change, 42, 331-345(2017).
[43] A Rezai, K Foley D, L Taylor. Global warming and economic externalities. Economic Theory, 49, 329-351(2011).
[44] K Riahi, P van Vuuren D, E Kriegler et al. The Shared Socioeconomic Pathways and their energy, land use, and greenhouse gas emissions implications: An overview. Global Environmental Change, 42, 153-168(2017).
[45] A Rogers. Introduction to Multiregional Mathematical Demography. New York:. Wiley.(1976).
[46] A Rohde R, R Muller, R Jacobsen et al. A new estimate of the average earth surface land temperature spanning 1753 to 2011. Geoinformatics & Geostatistics: An Overview, 1(2013).
[47] C Rosenzweig, J Elliott, D Deryng et al. Assessing agricultural risks of climate change in the 21st century in a global gridded crop model intercomparison. Proceedings of the National Academy of Sciences, 111, 3268-3273(2014).
[48] J Schewe, J Heinke, D Gerten et al. Multimodel assessment of water scarcity under climate change. Proceedings of the National Academy of Sciences, 111, 3245-3250(2014).
[49] B Sun, Y Tang Z. The trend of population in urban under the factors of inter povincial migration and rural-urban migration. Northwest Population, 1, 64-72(2011).
[50] E Taylor K, J Stouffer R, A Meehl G. An overview of CMIP5 and the experiment design. Bulletin of the American Meteorological Society, 93, 485-498(2012).
[51] E Trenberth K, T Fasullo J, G Shepherd T. Attribution of climate extreme events. Nature Climate Change, 5, 725-730(2015).
[52] World Population Prospects The 2010 Revision. New York: Department of Economic and Social Affairs, Population Division.(2011).
[53] P van Vuuren D, J Edmonds, M Kainuma et al. The representative concentration pathways: An overview. Climatic Change, 109, 5(2011).
[54] P van Vuuren D, J Kok M T, B Girod et al. Scenarios in global environmental assessments: Key characteristics and lessons for future use. Global Environmental Change, 22, 884-895(2012).
[55] Z Wang G. Rethinking the problems in the research of China's family planning policy adjustment. Chinese Journal of Population Science, 2-15(2015).
[56] J Wang Y, C Jing, G Cao L et al. The population patterns over China in the 1.5℃ and 2.0℃ warming targets. Climate Change Research, 13, 327-336(2017).
[57] L Weber C, P Peters G. Climate change policy and international trade: Policy considerations in the US. Energy Policy, 37, 432-440(2009).
[58] World Development Indicators. Washington: World Bank.(2017).
[59] Y Zeng, T Hesketh. The effects of China's universal two-child policy. The Lancet, 388, 1930-1938(2016).
[60] Y Zeng, Z Wang. A policy analysis on challenges and opportunities of population/household aging in China. Journal of Population Ageing, 7, 255-281(2014).
[61] Y Zhu, Y Lin L, Q Ke W. Trends in internal migration and mobility: International experiences and their implications for China. Population Research, 40, 50-60(2016).


Set citation alerts for the article
Please enter your email address

© Copyright 2018-2021 | Chinese Laser Press. All Rights Reserved 沪ICP备15018463号-20