• Acta Optica Sinica
  • Vol. 37, Issue 11, 1112004 (2017)
Huimin Yue*, Rong Li, Zhipeng Pan, Hongli Chen, Yuxiang Wu, and Yong Liu
Author Affiliations
  • College of Optoelectronic Information, University of Electronic Science and Technology of China, Chengdu, Sichuan 610054, China
  • show less
    DOI: 10.3788/AOS201737.1112004 Cite this Article Set citation alerts
    Huimin Yue, Rong Li, Zhipeng Pan, Hongli Chen, Yuxiang Wu, Yong Liu. High Quality Fringe Patterns Captured from Phase Measuring Deflectometry[J]. Acta Optica Sinica, 2017, 37(11): 1112004 Copy Citation Text show less
    Schematic of phase measuring deflectometry (PMD) system
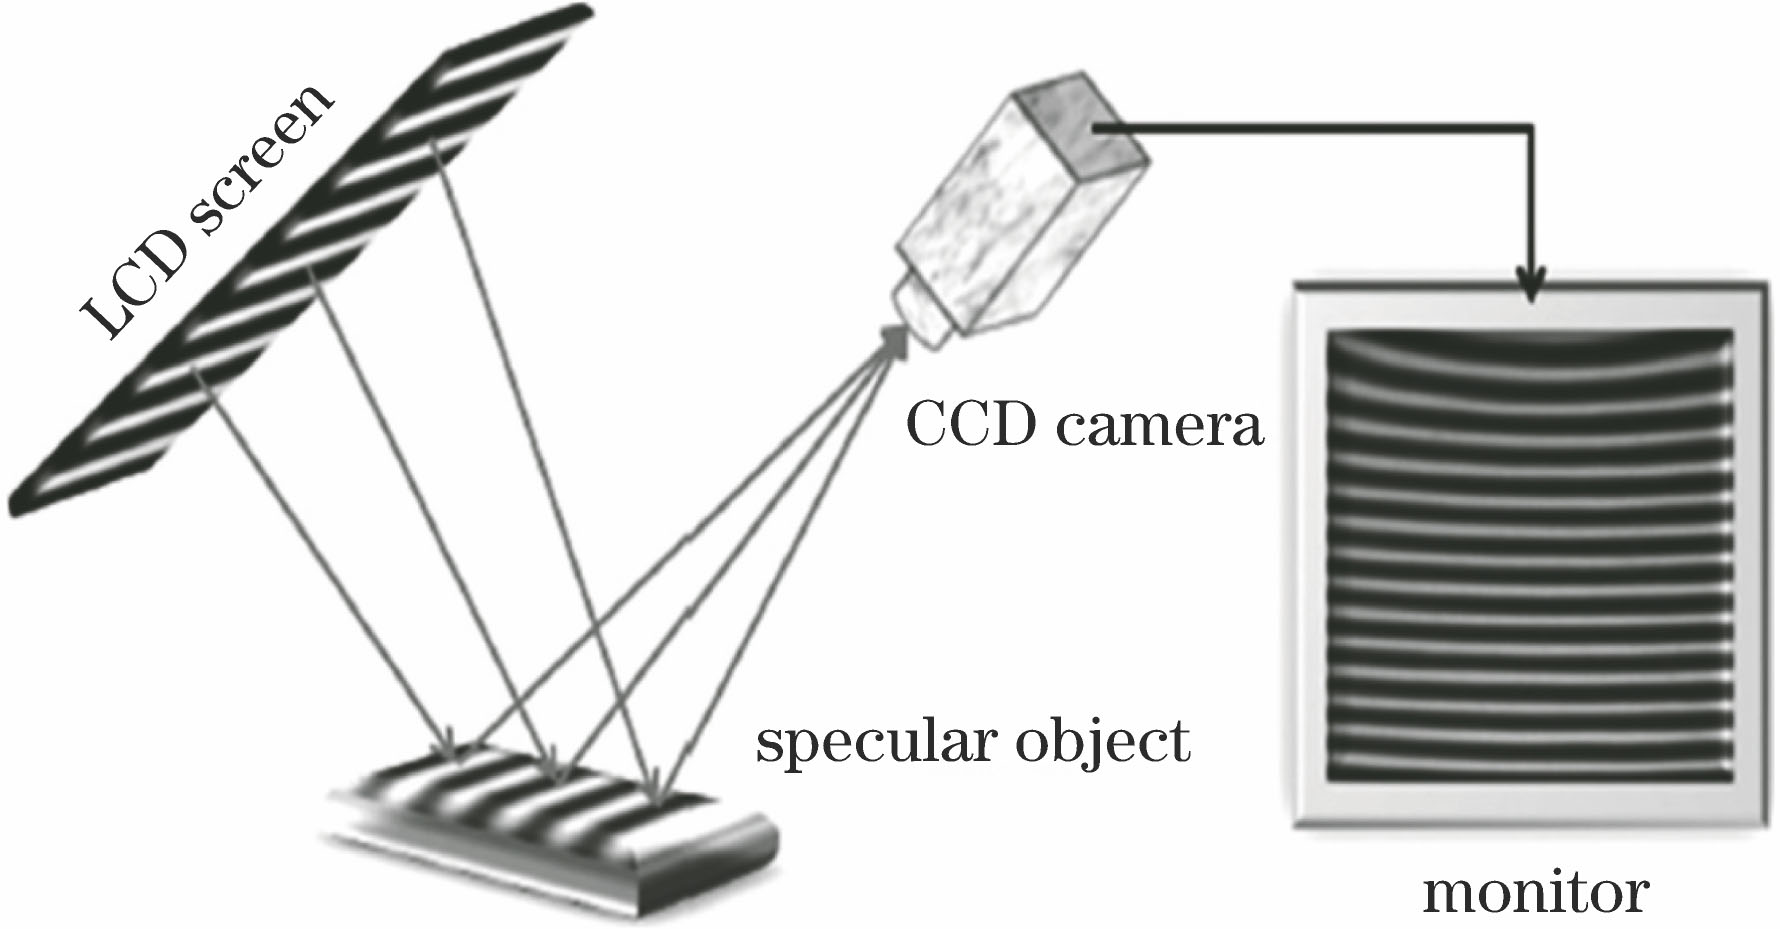
    Fig. 1. Schematic of phase measuring deflectometry (PMD) system
    Fringe quality analysis model in PMD system
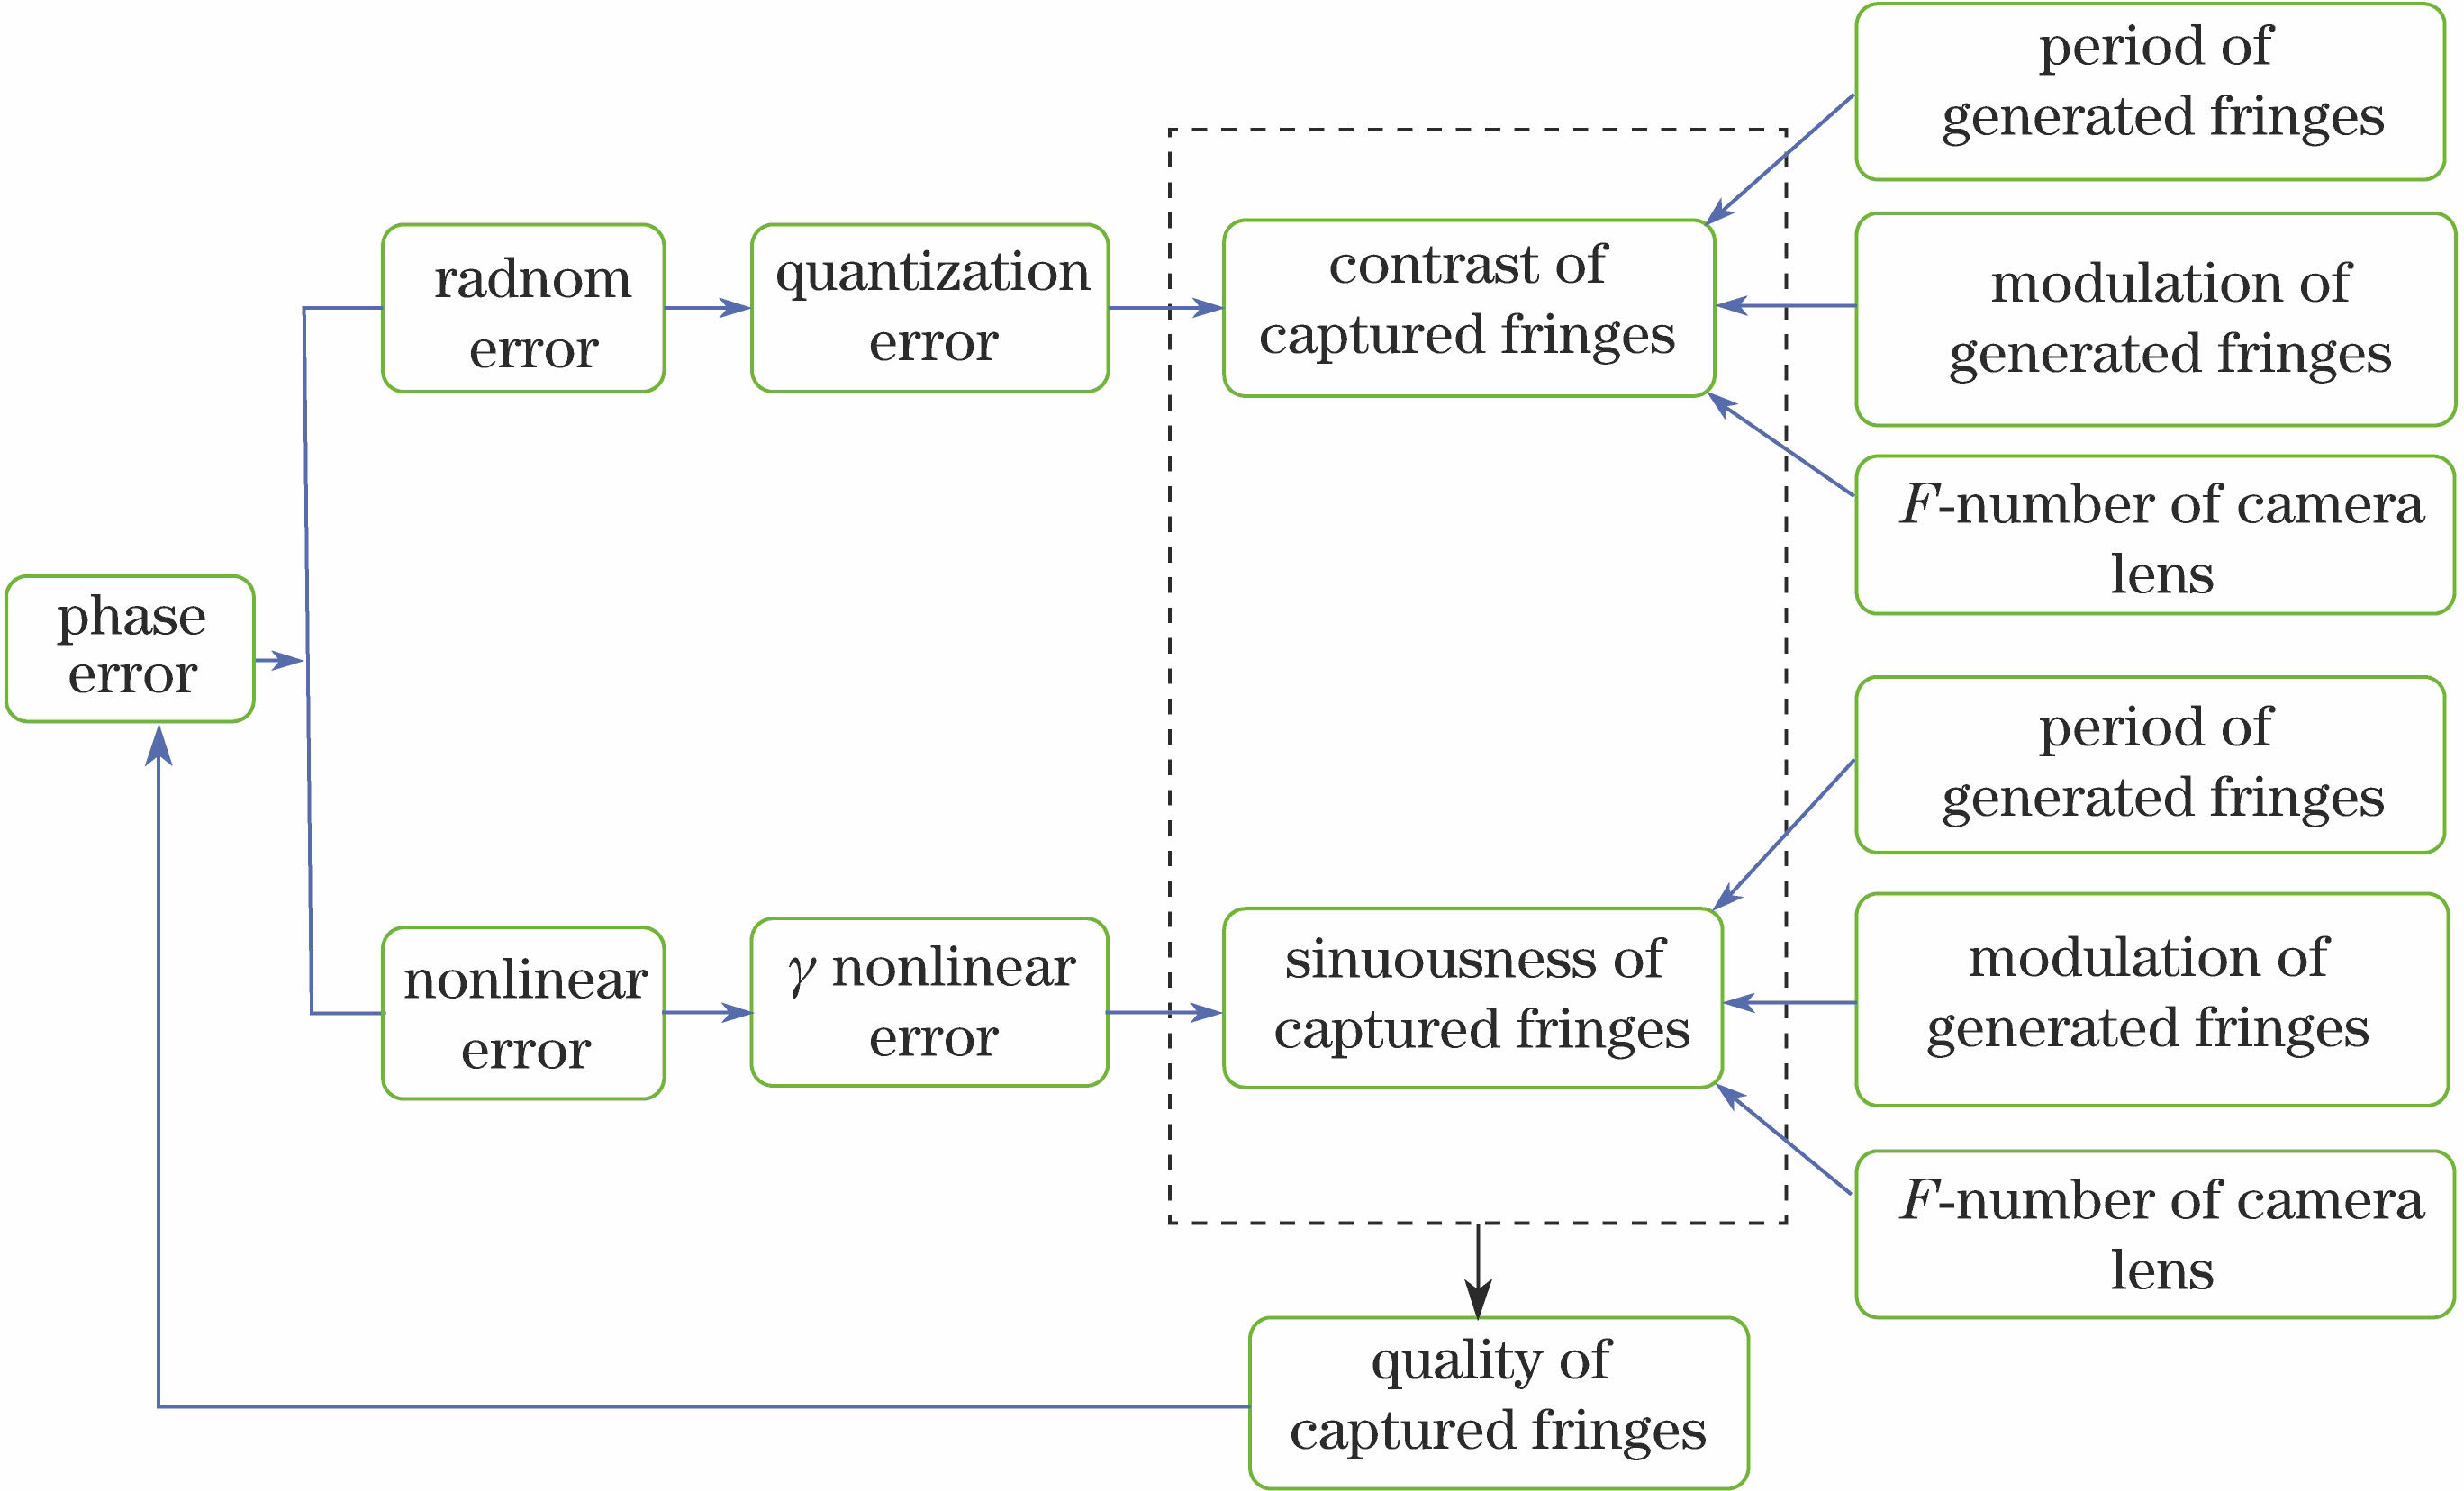
    Fig. 2. Fringe quality analysis model in PMD system
    Simulation result for the influence of dynamic range of fringe intensity on phase accuracy
    Fig. 3. Simulation result for the influence of dynamic range of fringe intensity on phase accuracy
    Measured response curve of system
    Fig. 4. Measured response curve of system
    Simulation results of direct relations between nonlinearity and RFFA/RFDA. (a) RFFA/RFDA=12.24 ; (b) RFFA/RFDA=4.23
    Fig. 5. Simulation results of direct relations between nonlinearity and RFFA/RFDA. (a) RFFA/RFDA=12.24 ; (b) RFFA/RFDA=4.23
    Simulation result for the effect of nonlinearity on phase error
    Fig. 6. Simulation result for the effect of nonlinearity on phase error
    Relationships between system parameters and contrast ratio of fringe pattern obtained by simulation. (a) Relationships between F value or fringe pattern period and contrast ratio of fringe pattern when b is 0.40; (b) relationships between fringe pattern period or modulation and contrast ratio of fringe patter when F value is fixed at certain value
    Fig. 7. Relationships between system parameters and contrast ratio of fringe pattern obtained by simulation. (a) Relationships between F value or fringe pattern period and contrast ratio of fringe pattern when b is 0.40; (b) relationships between fringe pattern period or modulation and contrast ratio of fringe patter when F value is fixed at certain value
    Relationships between system parameters and sinuousness of fringe pattern obtained by simulation. (a) Relationships between F value or fringe pattern period and sinuousness of fringe pattern when b is 0.40; (b) relationships between fringe pattern period or modulation and sinuousness of fringe pattern when F value is 11.0
    Fig. 8. Relationships between system parameters and sinuousness of fringe pattern obtained by simulation. (a) Relationships between F value or fringe pattern period and sinuousness of fringe pattern when b is 0.40; (b) relationships between fringe pattern period or modulation and sinuousness of fringe pattern when F value is 11.0
    Picture of experimental system
    Fig. 9. Picture of experimental system
    Fringe patterns captured by CCD camera in PMD system under different conditions. (a) b=0.40, F=5.6, T=20 pixel; (b) b=0.40, F=8.0, T=20 pixel; (c) b=0.40, F=8.0, T=80 pixel; (d) b=0.05, F=5.6, T=30 pixel; (e) b=0.45, F=5.6, T=30 pixel; (f) b=0.45, F=5.6, T=80 pixel
    Fig. 10. Fringe patterns captured by CCD camera in PMD system under different conditions. (a) b=0.40, F=5.6, T=20 pixel; (b) b=0.40, F=8.0, T=20 pixel; (c) b=0.40, F=8.0, T=80 pixel; (d) b=0.05, F=5.6, T=30 pixel; (e) b=0.45, F=5.6, T=30 pixel; (f) b=0.45, F=5.6, T=80 pixel
    Relationships between system parameters and contrast ratio of fringe pattern in PMD system. (a) Relationships between F value or fringe pattern period and contrast ratio of fringe pattern when b is 0.40; (b) relationships between fringe pattern period or modulation and contrast ratio of fringe pattern when F value is 5.6
    Fig. 11. Relationships between system parameters and contrast ratio of fringe pattern in PMD system. (a) Relationships between F value or fringe pattern period and contrast ratio of fringe pattern when b is 0.40; (b) relationships between fringe pattern period or modulation and contrast ratio of fringe pattern when F value is 5.6
    Relationships between system parameters and sinuousness of fringe pattern in PMD system. (a) Relationships between F value or fringe pattern period and sinuousness of fringe pattern when b is 0.40; (b) relationships between fringe pattern period or modulation and sinuousness of fringe pattern when F value is 5.6
    Fig. 12. Relationships between system parameters and sinuousness of fringe pattern in PMD system. (a) Relationships between F value or fringe pattern period and sinuousness of fringe pattern when b is 0.40; (b) relationships between fringe pattern period or modulation and sinuousness of fringe pattern when F value is 5.6
    Huimin Yue, Rong Li, Zhipeng Pan, Hongli Chen, Yuxiang Wu, Yong Liu. High Quality Fringe Patterns Captured from Phase Measuring Deflectometry[J]. Acta Optica Sinica, 2017, 37(11): 1112004
    Download Citation