
Yizhou Tan, Ying Gu. Characteristics of a Gaussian focus embedded within spiral patterns in common-path interferometry with phase apertures[J]. Advanced Photonics Nexus, 2023, 2(3): 036008
- Advanced Photonics Nexus
- Vol. 2, Issue 3, 036008 (2023)
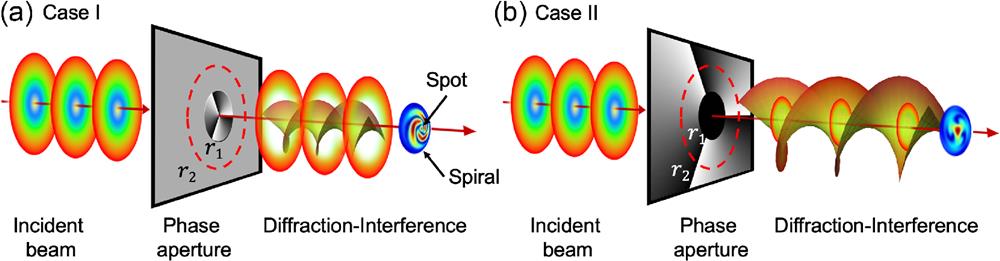
Fig. 1. Interference between diffracted vortex beam and diffracted plane wave beam through a phase aperture in common-path interferometry. (a) Case I: the inner circle zone (
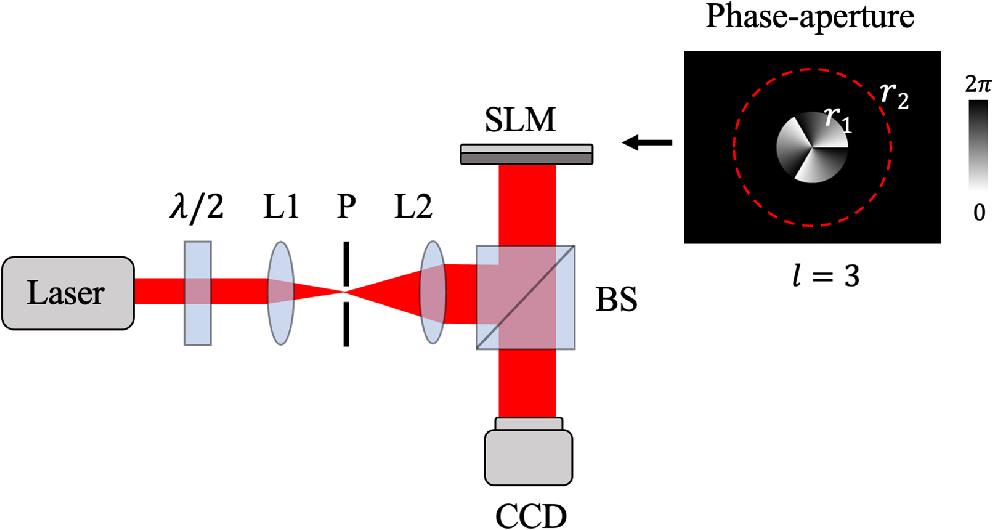
Fig. 2. Experimental setup of common-path interferometry with a phase aperture.
Fig. 3. (a) Circular phase-aperture element with a helical phase-modulated profile in the inner circle zone. (b) Numerically simulated light intensity distribution modulated by (a). (c) Experimentally recorded intensity distribution modulated by (a). (d) Circular phase-aperture element with a helical phase-modulated profile in the ring zone. (e) Numerically simulated light intensity distribution modulated by (d). (f) Experimentally recorded intensity distribution modulated by (d). The red dashed circle indicates the outer radius
Fig. 4. (a) Triangular phase-aperture element with a helical phase-modulated profile in the inner zone. The inner equilateral triangle has the side length
Fig. 5. (a), (d), (g), (j) Triangular phase-aperture element with a helical phase-modulated profile in the inner zone. The triangular phase aperture has a different side length,
Fig. 6. (a), (d), (g), (j) Triangular phase-aperture element with a helical phase-modulated profile inside. The orientation of the triangular phase aperture tilts with different angle
Fig. 7. (a) Triangular phase-aperture element with a helical phase-modulated profile inside. The outer zone of the phase aperture has 0 phase shift. (b) Numerically simulated intensity distribution. (c) Experimental recording. (d) The outer zone of the phase aperture has
Fig. 8. (a), (b) Triangular phase aperture with a helical phase-modulated profile inside (

Set citation alerts for the article
Please enter your email address
© Copyright 2018-2021 | Chinese Laser Press. All Rights Reserved 沪ICP备15018463号-20