
Axin Fan, Tingfa Xu, Geer Teng, Xi Wang, Chang Xu, Yuhan Zhang, Xin Xu, Jianan Li, "Deep learning reconstruction enables full-Stokes single compression in polarized hyperspectral imaging," Chin. Opt. Lett. 21, 051101 (2023)
- Chinese Optics Letters
- Vol. 21, Issue 5, 051101 (2023)
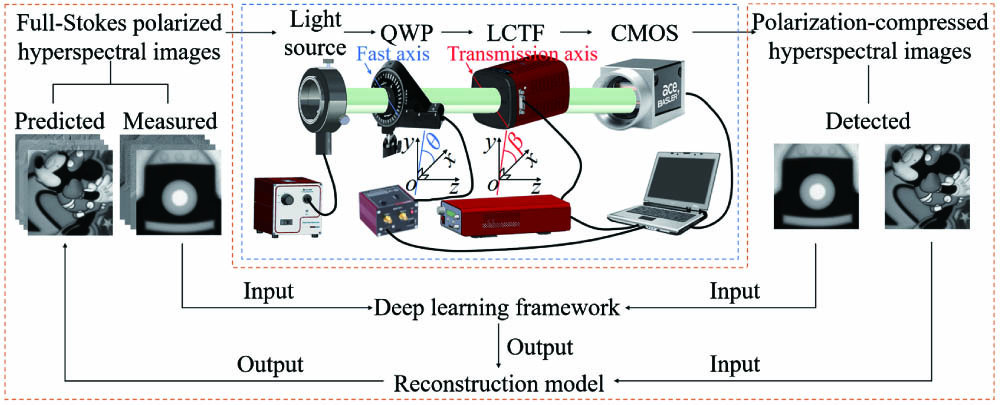
Fig. 1. Overall schematic diagram of DL-FSCPHI method.
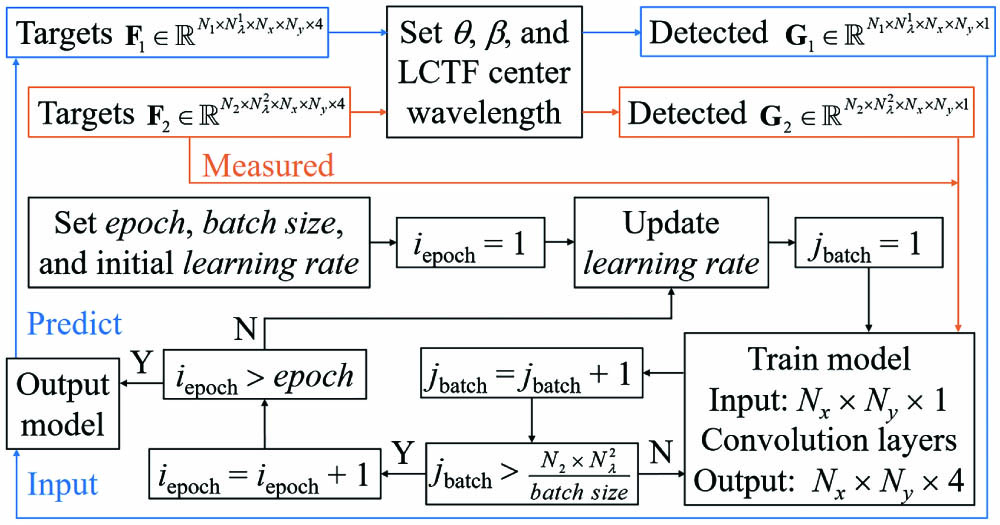
Fig. 2. The reconstruction strategy proposed in this work. F 2 is the measured full-Stokes images, while G 2 is the detected polarization-compressed images, containing N2 targets, Nλ2 spectral bands, and Nx × Ny spatial pixels. The epoch, the batch size, and the learning rate are parameters set for model training. The iepoch and the jbatch refer to training the ith epoch and jth batch. F 1 is the full-Stokes images predicted from the detected polarization-compressed images G 1, containing N1 targets and Nλ1 spectral bands.
Fig. 3. Measured and reconstructed full-Stokes images of three test targets in 6 spectral bands from 560 nm to 660 nm with an interval of 20 nm. The reconstructed images are marked with the PSNR and the SSIM values.
Fig. 4. PSNR and SSIM values of the reconstructed full-Stokes images of the three test targets in 18 spectral bands ranging from 520 nm to 690 nm at intervals of 10 nm.
Fig. 5. Loss curves of the training models under different settings, including two sets of training parameters (epoch = 20, batch size = 7 and epoch = 40, batch size = 5), two sets of polarization angles (θ = 114°, β = 0° and θ = 27°, β = 0°), and two convolution models (DL-M1 and DL-M2).
| ||||||||||||||||||||||||||||||||||||||||||||||||||||||||||||||||||||||||||||||||
Table 1. Average PSNR and SSIM Values of the Reconstructed Full-Stokes Images of 7 Test Targets in 18 Spectral Bands under Different Settings, Including Two Sets of Polarization Angles (θ = 114°, β = 0° and θ = 27°, β = 0°), Two Convolution Models and One Traditional Algorithm (DL-M1, DL-M2, and TwIST), and Two Sets of Training Parameters (Epoch = 20, Batch Size = 7 and Epoch = 40, Batch Size = 5)


Set citation alerts for the article
Please enter your email address

© Copyright 2018-2021 | Chinese Laser Press. All Rights Reserved 沪ICP备15018463号-20