Zemeng FAN1,1,1,1,1,1,1,1,1,*, Ruyu BAI1,1,1,1,1,1, and Tianxiang YUE1,1,1,1,1,1,1,1,1
Author Affiliations
11State Key Laboratory of Resources and Environment Information System, Institute of Geographic Sciences and Natural Resources Research, CAS, Beijing 100101, China12University of Chinese Academy of Sciences, Beijing 100049, China; 3. Jiangsu Center for Collaborative Innovation in Geographical Information Resource Development and Application, Nanjing 210023, China13Jiangsu Center for Collaborative Innovation in Geographical Information Resource Development and Application, Nanjing 210023, Chinashow less
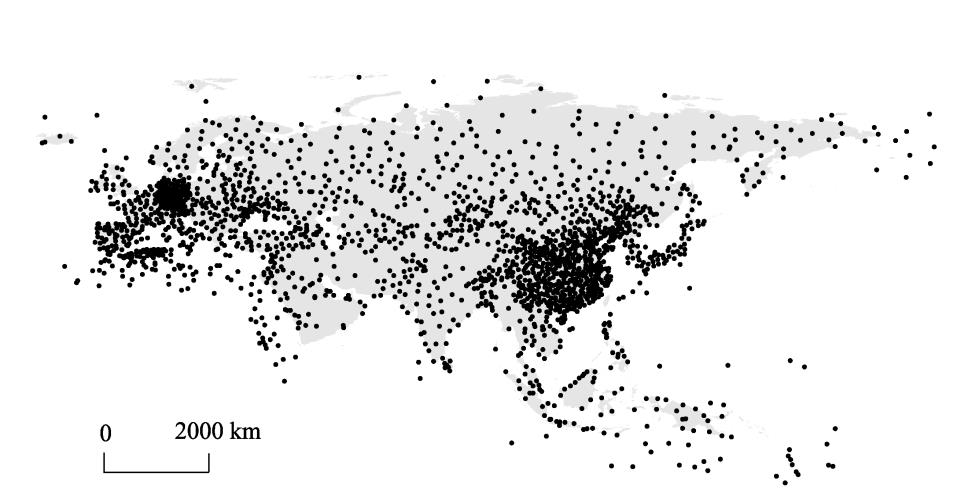
Fig. 1. Location of the weather observation stations in Eurasia
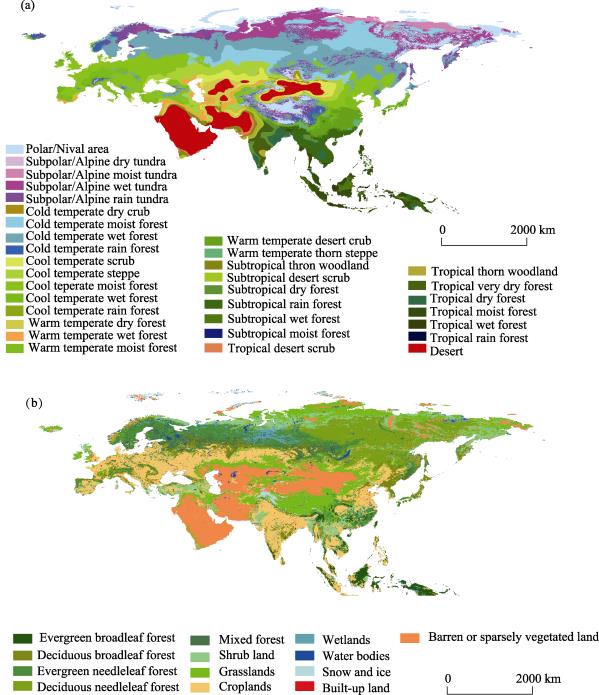
Fig. 2. The distribution of HLZ types during 1981-2010 on an average (a) and land cover (b) of Eurasia in 2010
Fig. 3. RCP26 scenario of land cover change in Eurasia
Fig. 4. RCP45 scenario of land cover change in Eurasia
Fig. 5. RCP85 scenario of land cover change in Eurasia
Table 1. Transition probability matrix from HLZ types in TO on an average to land cover types in 2010
Table 1. Transition probability matrix from HLZ types in TO on an average to land cover types in 2010 (Continued)
| Land cover type | 2010 | 2040 | 2070 | 2100 | Area change | Change rate (%) |
|---|
| Evergreen broadleaf forest | 2363080 | 2482321 | 2549012 | 2635963 | 272882 | 11.55 | | Deciduous broadleaf forest | 3268045 | 3256437 | 3354152 | 3400582 | 132537 | 4.06 | | Evergreen needleleaf forest | 4677409 | 4537064 | 4478604 | 4527778 | -149632 | -3.20 | | Deciduous needleleaf forest | 4796439 | 4715819 | 4564922 | 4298793 | -497646 | -10.38 | | Mixed forest | 1576935 | 1484708 | 1399023 | 1376441 | -200494 | -12.71 | | Shrub land | 4265659 | 4078250 | 4023800 | 3973782 | -291876 | -6.84 | | Grasslands | 8752493 | 8785628 | 8857383 | 8962695 | 210202 | 2.40 | | Wetlands | 907075 | 966590 | 969967 | 892091 | -14984 | -1.65 | | Croplands | 12226519 | 12544776 | 12692297 | 12748647 | 522127 | 4.27 | | Water bodies | 862333 | 892091 | 930923 | 986850 | 124517 | 14.44 | | Snow and Ice | 416393 | 384948 | 344849 | 311926 | -104468 | -25.09 | | Built-up land | 222231 | 225397 | 228141 | 230040 | 7809 | 3.51 | | Barren or sparsely vegetated land | 9747152 | 9727736 | 9688693 | 9736178 | -10974 | -0.11 |
|
Table 2. Area of land cover type based on RCP26 (km2)
| Land cover type | 2010 | 2040 | 2070 | 2100 | Area change | Change rate (%) |
|---|
| Evergreen broadleaf forest | 2363080 | 2453619 | 2572016 | 2685347 | 322267 | 13.64 | | Deciduous broadleaf forest | 3268045 | 3280286 | 3365759 | 3487322 | 219277 | 6.71 | | Evergreen needleleaf forest | 4677409 | 4537486 | 4523135 | 4777445 | 100036 | 2.14 | | Deciduous needleleaf forest | 4796439 | 4770058 | 4511738 | 3635687 | -1160752 | -24.20 | | Mixed forest | 1576935 | 1478165 | 1363145 | 1405776 | -171158 | -10.85 | | Shrub land | 4265659 | 4119615 | 3995520 | 4024644 | -241014 | -5.65 | | Grasslands | 8752493 | 8774231 | 8879543 | 9153058 | 400565 | 4.58 | | Wetlands | 907075 | 970389 | 954982 | 725154 | -181922 | -20.06 | | Croplands | 12226519 | 12508687 | 12679001 | 12772284 | 545765 | 4.46 | | Water bodies | 862333 | 888925 | 954138 | 1106302 | 243969 | 28.29 | | Snow and Ice | 416393 | 384526 | 343583 | 254732 | -161661 | -38.82 | | Built-up land | 222231 | 225608 | 228563 | 232150 | 9919 | 4.46 | | Barren or sparsely vegetated land | 9747152 | 9690170 | 9710642 | 9821863 | 74710 | 0.77 |
|
Table 3. Area of land cover type based on RCP45 (km2)
| Land cover type | 2010 | 2040 | 2070 | 2100 | Area change | Change rate (%) |
|---|
| Evergreen broadleaf forest | 2363080 | 2451298 | 2603673 | 2746340 | 383259 | 16.22 | | Deciduous broadleaf forest | 3268045 | 3294215 | 3463473 | 3503994 | 235949 | 7.22 | | Evergreen needleleaf forest | 4677409 | 4522924 | 4554158 | 4895208 | 217799 | 4.66 | | Deciduous needleleaf forest | 4796439 | 4783565 | 4405371 | 3232589 | -1563850 | -32.60 | | Mixed forest | 1576935 | 1427092 | 1263320 | 1275772 | -301162 | -19.10 | | Shrub land | 4265659 | 4136499 | 3979058 | 4133755 | -131904 | -3.09 | | Grasslands | 8752493 | 8763679 | 8958474 | 9317041 | 564548 | 6.45 | | Wetlands | 907075 | 973343 | 856002 | 636725 | -270350 | -29.80 | | Croplands | 12226519 | 12488005 | 12645656 | 12802252 | 575733 | 4.71 | | Water bodies | 862333 | 897789 | 1002046 | 1190721 | 328387 | 38.08 | | Snow and Ice | 416393 | 386425 | 310237 | 227296 | -189097 | -45.41 | | Built-up land | 222231 | 226874 | 231306 | 232995 | 10763 | 4.84 | | Barren or sparsely vegetated land | 9747152 | 9730058 | 9808989 | 9887076 | 139923 | 1.44 |
|
Table 4. Area of land cover type based on RCP85 (km2)
| Land cover type | From 2011 to 2040 | From 2041 to 2070 | From 2071 to 2100 |
|---|
| Area | Change rate (%) | Area | Change rate (%) | Area | Change rate (%) |
|---|
| Evergreen broadleaf forest | 119241 | 5.05 | 66690 | 2.69 | 86951 | 3.41 | | Deciduous broadleaf forest | -11608 | -0.36 | 97714 | 3.00 | 46430 | 1.38 | | Evergreen needleleaf forest | -140345 | -3.00 | -58460 | -1.29 | 49174 | 1.10 | | Deciduous needleleaf forest | -80620 | -1.68 | -150898 | -3.20 | -266129 | -5.83 | | Mixed forest | -92227 | -5.85 | -85685 | -5.77 | -22582 | -1.61 | | Shrub land | -187409 | -4.39 | -54450 | -1.34 | -50018 | -1.24 | | Grasslands | 33134 | 0.38 | 71756 | 0.82 | 105312 | 1.19 | | Wetlands | 59515 | 6.56 | 3377 | 0.35 | -77876 | -8.03 | | Croplands | 318257 | 2.60 | 147521 | 1.18 | 56349 | 0.44 | | Water bodies | 29757 | 3.45 | 38832 | 4.35 | 55927 | 6.01 | | Snow and Ice | -31446 | -7.55 | -40099 | -10.42 | -32923 | -9.55 | | Built-up land | 3166 | 1.42 | 2744 | 1.22 | 1899 | 0.83 | | Barren or sparsely vegetated land | -19416 | -0.20 | -39043 | -0.40 | 47485 | 0.49 |
|
Table 5. Scenario of land cover change based on RCP26 (km2)
| Land cover type | From 2011 to 2040 | From 2041 to 2070 | From 2071 to 2100 |
|---|
| Area | Change rate (%) | Area | Change rate (%) | Area | Change rate (%) |
|---|
| Evergreen broadleaf forest | 90539 | 3.83 | 118397 | 4.83 | 113332 | 4.41 | | Deciduous broadleaf forest | 12241 | 0.37 | 85474 | 2.61 | 121562 | 3.61 | | Evergreen needleleaf forest | -139923 | -2.99 | -14351 | -0.32 | 254310 | 5.62 | | Deciduous needleleaf forest | -26381 | -0.55 | -258320 | -5.42 | -876051 | -19.42 | | Mixed forest | -98769 | -6.26 | -115020 | -7.78 | 42631 | 3.13 | | Shrub land | -146044 | -3.42 | -124095 | -3.01 | 29124 | 0.73 | | Grasslands | 21738 | 0.25 | 105312 | 1.20 | 273515 | 3.08 | | Wetlands | 63314 | 6.98 | -15406 | -1.59 | -229829 | -24.07 | | Croplands | 282168 | 2.31 | 170314 | 1.36 | 93282 | 0.74 | | Water bodies | 26592 | 3.08 | 65213 | 7.34 | 152164 | 15.95 | | Snow and Ice | -31868 | -7.65 | -40943 | -10.65 | -88850 | -25.86 | | Built-up land | 3377 | 1.52 | 2955 | 1.31 | 3588 | 1.57 | | Barren or sparsely vegetated land | -56982 | -0.58 | 20471 | 0.21 | 111221 | 1.15 |
|
Table 6. Scenario of land cover change based on RCP45 (km2)
| Land cover type | From 2011 to 2040 | From 2041 to 2070 | From 2071 to 2100 |
|---|
| Area | Change rate (%) | Area | Change rate (%) | Area | Change rate (%) |
|---|
| Evergreen broadleaf forest | 88217 | 3.73 | 152375 | 6.22 | 142667 | 5.48 | | Deciduous broadleaf forest | 26170 | 0.80 | 169259 | 5.14 | 40521 | 1.17 | | Evergreen needleleaf forest | -154486 | -3.30 | 31235 | 0.69 | 341050 | 7.49 | | Deciduous needleleaf forest | -12874 | -0.27 | -378194 | -7.91 | -1172782 | -26.62 | | Mixed forest | -149843 | -9.50 | -163772 | -11.48 | 12452 | 0.99 | | Shrub land | -129160 | -3.03 | -157440 | -3.81 | 154697 | 3.89 | | Grasslands | 11185 | 0.13 | 194795 | 2.22 | 358567 | 4.00 | | Wetlands | 66268 | 7.31 | -117341 | -12.06 | -219277 | -25.62 | | Croplands | 261486 | 2.14 | 157651 | 1.26 | 156596 | 1.24 | | Water bodies | 35456 | 4.11 | 104257 | 11.61 | 188675 | 18.83 | | Snow and Ice | -29969 | -7.20 | -76188 | -19.72 | -82941 | -26.73 | | Built-up land | 4643 | 2.09 | 4432 | 1.95 | 1688 | 0.73 | | Barren or sparsely vegetated land | -17095 | -0.18 | 78931 | 0.81 | 78087 | 0.80 |
|
Table 7. Scenario of land cover change based on RCP85 (km2)