• Photonics Research
  • Vol. 9, Issue 6, 992 (2021)
Tianfeng Feng1、†, Changliang Ren2、5、†,*, Qin Feng1、†, Maolin Luo1, Xiaogang Qiang3, Jing-Ling Chen4、6、*, and Xiaoqi Zhou1、7、*
Author Affiliations
  • 1State Key Laboratory of Optoelectronic Materials and Technologies and School of Physics, Sun Yat-sen University, Guangzhou 510275, China
  • 2Key Laboratory of Low-Dimensional Quantum Structures and Quantum Control of Ministry of Education, Key Laboratory for Matter Microstructure and Function of Hunan Province, Department of Physics and Synergetic Innovation Center for Quantum Effects and Applications, Hunan Normal University, Changsha 410081, China
  • 3National Innovation Institute of Defense Technology, AMS, Beijing 100071, China
  • 4Theoretical Physics Division, Chern Institute of Mathematics, Nankai University, Tianjin 300071, China
  • 5e-mail: renchangliang@hunnu.edu.cn
  • 6e-mail: chenjl@nankai.edu.cn
  • 7e-mail: zhouxq8@mail.sysu.edu.cn
  • show less
    DOI: 10.1364/PRJ.411033 Cite this Article Set citation alerts
    Tianfeng Feng, Changliang Ren, Qin Feng, Maolin Luo, Xiaogang Qiang, Jing-Ling Chen, Xiaoqi Zhou. Steering paradox for Einstein–Podolsky–Rosen argument and its extended inequality[J]. Photonics Research, 2021, 9(6): 992 Copy Citation Text show less
    Experimental setup. Polarization-entangled photons pairs are generated via nonlinear crystal. An asymmetric loss interferometer along with half-wave plates (HWPs) is used to prepare two-qubit pure entangled states. The projective measurements are performed using wave plates and polarization beam splitter (PBS).
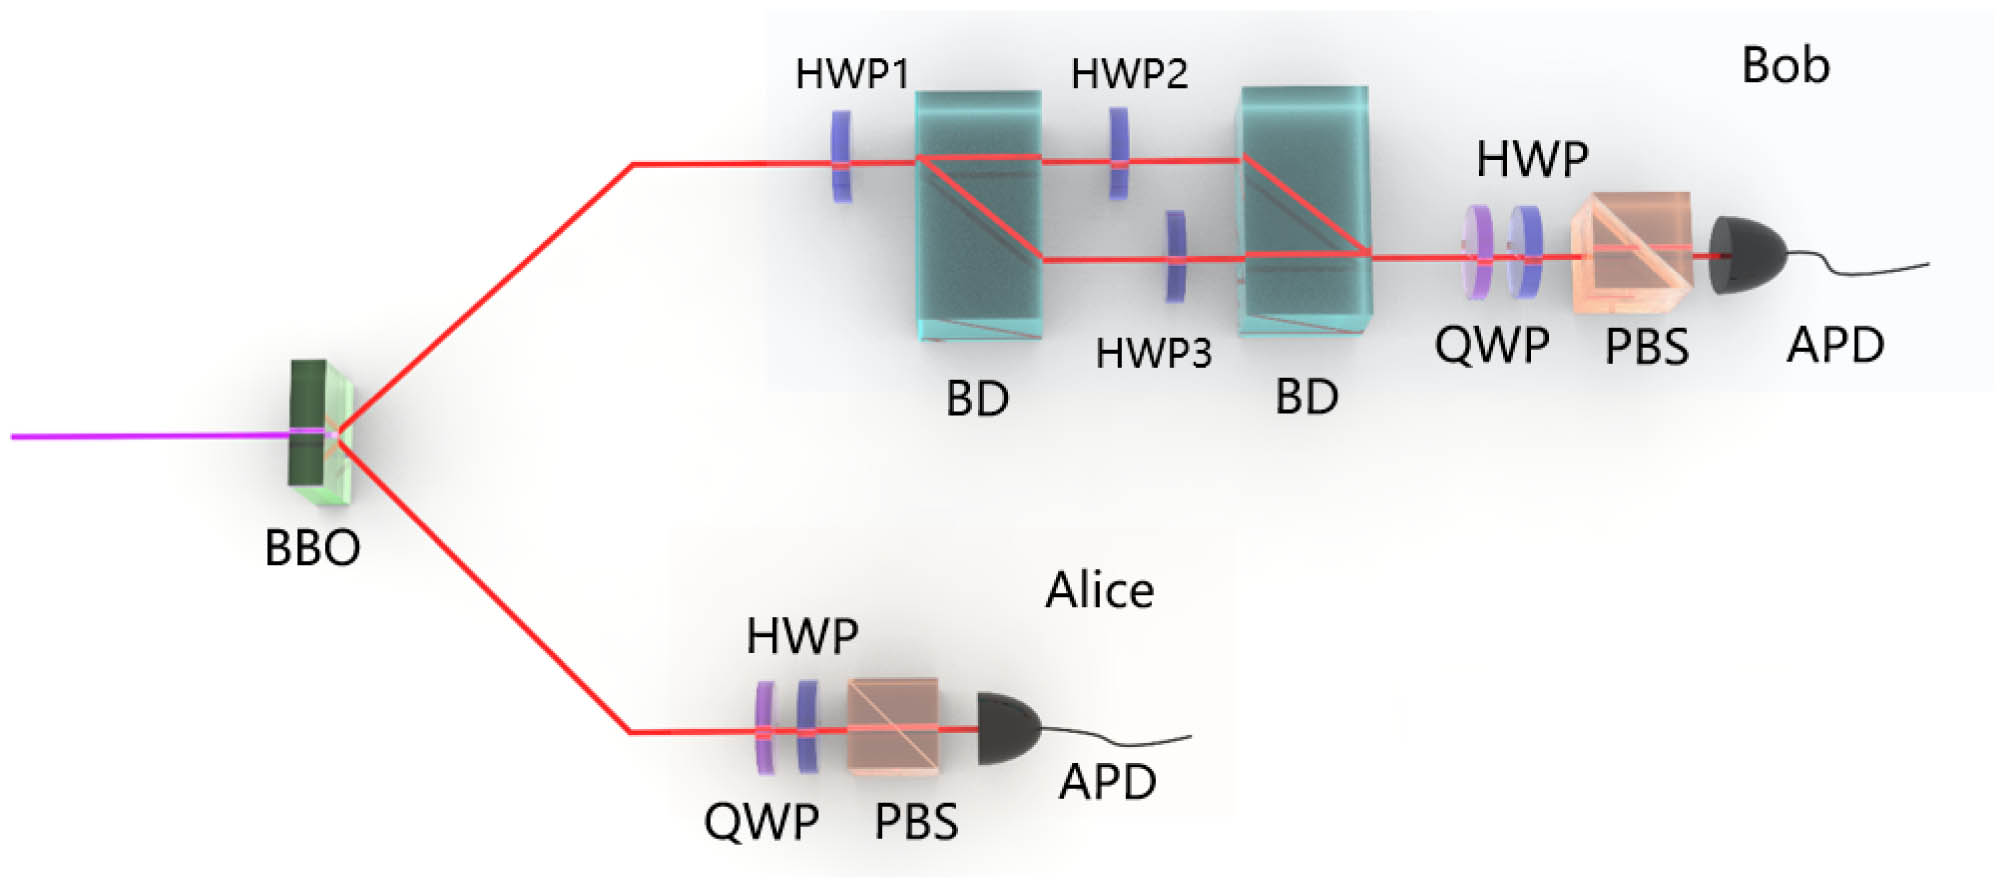
    Fig. 1. Experimental setup. Polarization-entangled photons pairs are generated via nonlinear crystal. An asymmetric loss interferometer along with half-wave plates (HWPs) is used to prepare two-qubit pure entangled states. The projective measurements are performed using wave plates and polarization beam splitter (PBS).
    Experimental results for pure states. (a) Experimental results concerning the steering paradox “2=1.” The black and blue solid lines represent the quantum prediction S≡PtotalQM=2 and the classical bound C=1 based on the LHV models, respectively. The black cubes and the red lines show the experimental results with error bar. (b) Experimental results for the three-setting GLSI (7). The black and blue solid lines represent the quantum and classic bounds, respectively, which are obtained by maximizing the difference between S3′ and CLHS′ for any fixed α. The black (blue) dot line represents the quantum violation ⟨S3′′⟩=1+2 sin 2α (classical value C=3) of the usual three-setting LSI (8). The red cubes are the experimental points for the inequality (7). The light yellow range is α∈(0,(arcsin3−12)/2], where the LSI (8) cannot detect the steerability but the GLSI can. (c) Experimental violation for α=π36,π18.
    Fig. 2. Experimental results for pure states. (a) Experimental results concerning the steering paradox “2=1.” The black and blue solid lines represent the quantum prediction SPtotalQM=2 and the classical bound C=1 based on the LHV models, respectively. The black cubes and the red lines show the experimental results with error bar. (b) Experimental results for the three-setting GLSI  (7). The black and blue solid lines represent the quantum and classic bounds, respectively, which are obtained by maximizing the difference between S3 and CLHS for any fixed α. The black (blue) dot line represents the quantum violation S3=1+2sin2α (classical value C=3) of the usual three-setting LSI (8). The red cubes are the experimental points for the inequality (7). The light yellow range is α(0,(arcsin312)/2], where the LSI (8) cannot detect the steerability but the GLSI can. (c) Experimental violation for α=π36,π18.
    Experimental results for mixed states. (a), (b) Steering detection for the generalized Werner state ρ1 and the asymmetric mixed state ρ2. The light purple and pink surfaces represent the quantum value and the classical bound of the GLSI (7), respectively. The black (blue) dots denote results for the quantum states that can (cannot) experimentally violate the GLSI (7). The zoom shows the area where steering cannot be detected by usual LSI (8), whereas GLSI may be useful.
    Fig. 3. Experimental results for mixed states. (a), (b) Steering detection for the generalized Werner state ρ1 and the asymmetric mixed state ρ2. The light purple and pink surfaces represent the quantum value and the classical bound of the GLSI (7), respectively. The black (blue) dots denote results for the quantum states that can (cannot) experimentally violate the GLSI (7). The zoom shows the area where steering cannot be detected by usual LSI (8), whereas GLSI may be useful.
    Detecting EPR steerability of the generalized Werner state by using the usual three-setting LSI (blue line) and three-setting GLSI (red line). For a fixed parameter α, the threshold value of the visibility is given by VMin, below which the steering inequalities cannot be violated. It can be observed that the GLSI is stronger than the usual LSI in detecting EPR steerability.
    Fig. 4. Detecting EPR steerability of the generalized Werner state by using the usual three-setting LSI (blue line) and three-setting GLSI (red line). For a fixed parameter α, the threshold value of the visibility is given by VMin, below which the steering inequalities cannot be violated. It can be observed that the GLSI is stronger than the usual LSI in detecting EPR steerability.
    Generalized Werner states violate the usual three-setting LSI in the blue region and three-setting generalized LSI in the red region. It can be observed that the GLSI is stronger than the usual LSI in detecting EPR steerability.
    Fig. 5. Generalized Werner states violate the usual three-setting LSI in the blue region and three-setting generalized LSI in the red region. It can be observed that the GLSI is stronger than the usual LSI in detecting EPR steerability.
    Detecting EPR steerability of the mixed state Eq. (B16) by using the usual three-setting LSI (blue line) and three-setting GLSI (red line). For a fixed parameter α, the threshold value of the visibility is given by VMax, above which the steering inequalities cannot be violated. It can be observed that the GLSI is stronger than the usual LSI in detecting EPR steerability.
    Fig. 6. Detecting EPR steerability of the mixed state Eq. (B16) by using the usual three-setting LSI (blue line) and three-setting GLSI (red line). For a fixed parameter α, the threshold value of the visibility is given by VMax, above which the steering inequalities cannot be violated. It can be observed that the GLSI is stronger than the usual LSI in detecting EPR steerability.
    Mixed states Eq. (B16) violate the usual three-setting LSI in the blue region and three-setting GLSI in the red region. It can be observed that the GLSI is stronger than the usual LSI in detecting EPR steerability.
    Fig. 7. Mixed states Eq. (B16) violate the usual three-setting LSI in the blue region and three-setting GLSI in the red region. It can be observed that the GLSI is stronger than the usual LSI in detecting EPR steerability.
    Experimental setup and the specific angles for state preparation.
    Fig. 8. Experimental setup and the specific angles for state preparation.
    Tianfeng Feng, Changliang Ren, Qin Feng, Maolin Luo, Xiaogang Qiang, Jing-Ling Chen, Xiaoqi Zhou. Steering paradox for Einstein–Podolsky–Rosen argument and its extended inequality[J]. Photonics Research, 2021, 9(6): 992
    Download Citation