
Xianming Xiong, Hongqiang Shi, Xingyu Zeng. Surface Defect Detectionon Polished Surface Based on Reflection Moiré[J]. Laser & Optoelectronics Progress, 2019, 56(14): 141501
- Laser & Optoelectronics Progress
- Vol. 56, Issue 14, 141501 (2019)
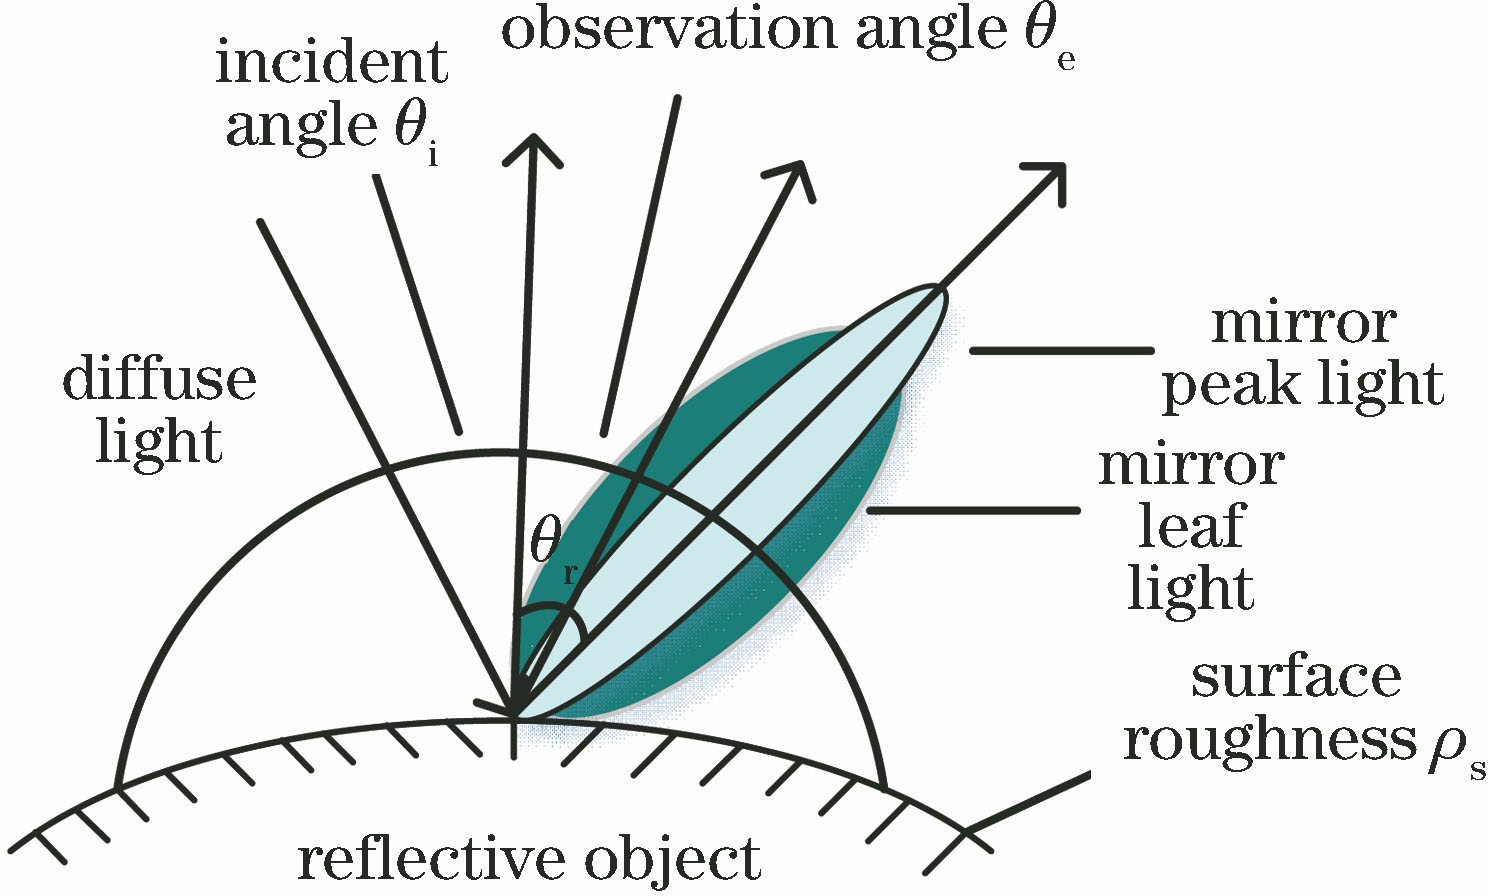
Fig. 1. Illumination model of high reflection surface
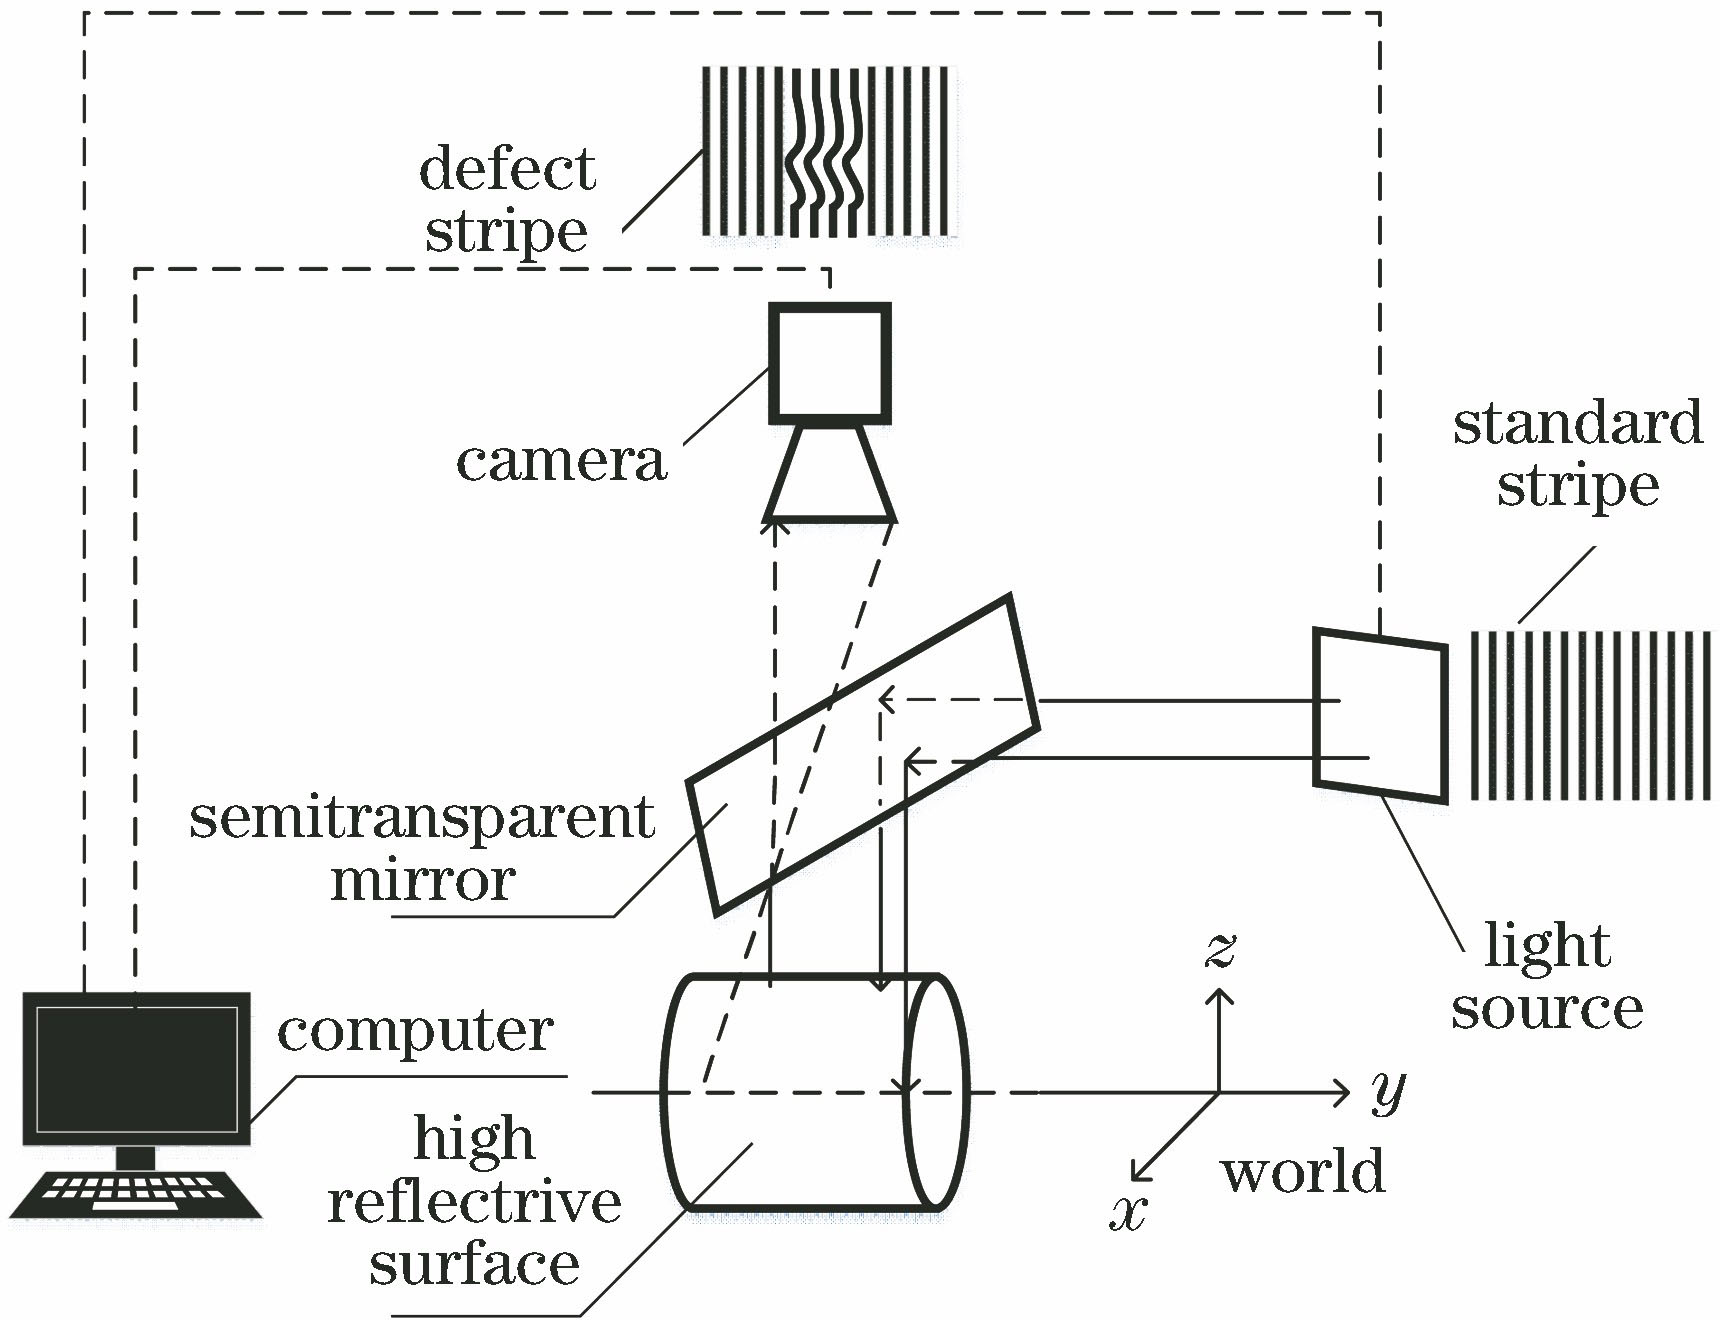
Fig. 2. Schematic of defect detection device
Fig. 3. Schematic of deflection light in stripe direction
Fig. 4. Schematic of effective detection area
Fig. 5. Images of standard stripe. (a) Stripe image generated by MATLAB; (b) moiré image taken by camera
Fig. 6. Different types of defect samples. (a) Standard surface; (b) sand hole; (c) orange skin; (d) belt marks
Fig. 7. Characterizations of different defects on moiré image. (a) Standard surface; (b) sand hole; (c) orange skin; (d) belt marks
Fig. 8. Stripe image of sand hole defect
Fig. 9. Defect stripe images in different stripe distances. (a) Stripe spacing of 0.25 mm; (b) stripe spacing of 0.50 mm; (c) stripe spacing of 2.00 mm
Fig. 10. Gray distributions of different defects. (a) Standard surface; (b) sand hole; (c) orange skin; (d) belt marks
Fig. 11. Gray distributions of improved fringe images. (a) Standard surface; (b) sand hole; (c) orange skin; (d) belt marks
Fig. 12. Diagram of defect detection algorithm
Fig. 13. Image preprocessing module. (a) Original image; (b) image centerline; (c) corrected image centerline; (d) corrected image
Fig. 14. Processing results of sand hole defect by algorithm. (a) Original image; (b) ROI grayscale image;(c) image after defect enhancement;(d) image after defect feature extraction; (e) morphologically processed image; (f) identification result
Fig. 15. Processing results of belt mark defect by algorithm. (a) Original image; (b) ROI grayscale image;(c) image after defect enhancement;(d) image after defect feature extraction; (e) morphologically processed image; (f) identification result
Fig. 16. Processing results of orange skin defect by algorithm. (a) Original image; (b) ROI grayscale image;(c) image after defect enhancement;(d) image after defect feature extraction; (e) morphologically processed image; (f) identification results
Fig. 17. Defect detection and labeling results. (a) Sand hole; (b) orange skin; (c) belt mark; (d) pit
|
Table 1. Different defect detection results and identifying statistical results

Set citation alerts for the article
Please enter your email address
© Copyright 2018-2021 | Chinese Laser Press. All Rights Reserved 沪ICP备15018463号-20