Abstract
In this work, we show how fiber-based terahertz systems can be robustly configured for accurate terahertz ellipsometry. To this end, we explain how our algorithms can be successfully applied to achieve accurate spectroscopic ellipsometry with a high tolerance on the imperfect polarizer extinction ratio and pulse shift errors. Highly accurate characterization of transparent, absorptive, and conductive samples comprehensively demonstrates the versatility of our algorithms. The improved accuracy we achieve is a fundamental breakthrough for reflection-based measurements and overcomes the hurdle of phase uncertainty.1. INTRODUCTION
Terahertz time-domain spectroscopy (THz-TDS) has become a mature and widely applied technique in the THz community. The ability to detect the THz electric field in the time domain provides broadband amplitude and phase information in the frequency domain, making it a powerful tool for sample characterization [1]. Applications can be found from dielectric materials [2–4] and liquids [5,6] to more complicated structures such as biomedical tissues [7–9] and conductive thin films [10,11]. Among these applications, transmission and reflection are the two basic geometries. Of these, transmission geometry is most widely used, as it usually provides the best phase contrast (generated by the optical path difference between the signals passing through the sample and the air). For opaque samples, a reflection geometry is needed: different geometries have been designed for different sample types. The most typical reflection geometry collects a sample reflection and a reference signal. The latter is usually reflected from a metal mirror. This method is straightforward but has a significant phase misalignment problem, which is the bottleneck for achieving high accuracy [12]. Although many approaches have been published for calibrating this phase error [13–15], they still have some limitations on either the accuracy or the sample type [16,17]. Window-based reflection and attenuated total reflection (ATR) have a fixed window or prism surface providing a reference signal without phase misalignment, but they are basically only applicable for liquid or soft tissues, as solid samples would have a contact problem [18–21]. None of these methods provides a perfect solution for accurate reflection measurement.
Ellipsometry is another reflection-mode characterization technique. It is well known for its high accuracy and has been widely applied in the region from infrared to ultraviolet [22]. The basic principle of ellipsometry compares the difference between the and reflections to characterize sample properties. It is promising to apply this technique in the THz region because the self-reference mechanism avoids the phase-misalignment problem. Since no window or prism is needed, it has almost no limitation on sample types. However, ellipsometry has not been widely applied in the THz region, mainly due to the difficulties in accurately controlling and manipulating the polarization. Hofmann et al. proposed a THz ellipsometer working in the frequency domain by using a backward wave oscillator (BWO) as an emitter [23]. However, the BWO provides narrow frequency tuning ability below 200 GHz. The assistance of a frequency multiplier makes the spectrum discrete, and the power exponentially drops with frequencies. Free-spaced time-domain THz ellipsometer research [24–26] has opened up new methods to study doped semiconductors and conductive thin films, showing the great capability of ellipsometry versus transmission on conductive samples. However, the most important shortcoming for free-space-based ellipsometers is the bad flexibility on the incident angle. Variable incident angle control is important in ellipsometry, as the incident angle needs to be adjusted close to the Brewster angle of a specific sample to provide the best sensitivity. Furthermore, very few details of the accuracy analysis and reliability are given in the aforementioned ellipsometer publications. As a relatively newly developed technique, it is important to demonstrate its accuracy before utilizing it as a characterization tool. Neshat and Armitage have proposed a half free-space and half fiber-based THz ellipsometer that gives better flexibility on the incident angle [27]. However, the result from their work actually gives worse accuracy, mainly due to improper incident angle setting and limited precision on polarization manipulations.
In this work, building on our recently presented conference proceedings [28], we develop and test a fully fiber-based THz ellipsometer. The highly flexible incident angle control is very robust and enables the ellipsometer to be used for characterizing different sample types. Thorough error analysis is crucial for accurate characterization. Furthermore, understanding the experimental causes of error helps improve the measurement configuration. For example, Soltani et al. performed comprehensive analysis on the propagation of random and systematic errors for an ATR geometry and proposed an alternative configuration that greatly reduced the misalignment influence [29]. In this work, we explain how error propagation analysis can be used to optimize the orientation setting of the polarizer. We also derive an effective algorithm to accurately compensate for the phase error and limited extinction ratio (ER, defined as the ratio between the transmitted intensity from the passing and the blocking directions of a polarizer) of the polarizer. Ellipsometry measurements of different samples are presented to highlight the versatility and robustness of our work. The characterization of a standard silicon (Si) wafer shows the significantly improved accuracy by the developed ellipsometer and the proposed algorithm, while the measurements of absorptive Glabervel glass and conductive indium tin oxide (ITO) thin film demonstrate both the accuracy and the superiority of ellipsometry over other geometries on opaque materials.
Sign up for Photonics Research TOC. Get the latest issue of Photonics Research delivered right to you!Sign up now
2. BASIC PRINCIPLE OF SPECTROSCOPIC ELLIPSOMETRY
According to Fresnel’s equations, samples exhibit different reflection responses to - and -polarized light at oblique incident angles. Ellipsometry utilizes this characteristic to extract the sample properties. This can be realized by a polarizer-sample-analyzer (i.e., rotating polarizer) configuration. The polarizer on the emitter side generates a 45° linear polarized light incident onto the sample surface, providing equal and components. The analyzer on the detector side selects the reflected - () or -components () to be measured by the detector. The complex ratio between them is defined as , expressed as In this equation, and represent the magnitude and phase of . and are the - and - reflection coefficients, which can be expressed by Fresnel’s equations based on an established optical model. The reflection coefficients may also contain unknown sample properties such as the complex refractive index and sample thickness . These parameters are then extracted by solving the equation. For bulk materials where only the sample surface reflection is taken into the calculation, the complex permittivity solution can be derived analytically [22,25]. For thin-film or multiple-layer structures, numerical optimization by solving each frequency point individually to a finite accuracy is preferred, as the analytical solution could be very complicated. In this case, a variety of optimization algorithms can be applied [30,31].
3. DEVELOPMENT OF THE FIBER-BASED THZ ELLIPSOMETER
Figure 1(a) shows the schematic diagram and Fig. 1(b) is a photograph of the developed fiber-based THz-TDS ellipsometer. Fiber-coupled photoconductive antennas from Menlo Systems were used as our THz source and detector. Two optical rails connecting to a precise goniometer can be freely rotated to vary the incident angle from the minimum 45° to the maximum 90°, which then results in a transmission mode. A pair of short focal length (SFL) TPX plano-convex lenses with an number of collect and focus light from the emitter and to the detector. Another pair of long focal length (LFL) lenses with were used for focusing and collecting the beam above the sample. It is important to use lenses with a larger number to reduce the angular divergence of the light focusing onto the sample. It has been studied by Rhaleb et al. that the angular divergence of a focal Gaussian beam has a significant influence on the ellipsometry accuracy [32]. The optics provides a divergent angle of 9.7° (170 mrad) at 0.5 THz, which is about half of the optics. Further increasing the number gives smaller divergence but also larger beam size, as they are physically limited by each other according to the diffraction limit equation. When a sufficient sample area can be provided, a collimated beam can be used to provide the lowest angular divergence by simply taking off the lower two focal lenses. Three wire-grid polarizers were used in this system. Polarizers 1 and 3 (P1 and P3) are bilayer polarizers made by Huang et al., providing a good ER but relatively smaller aperture of 2 cm in diameter [33]. Polarizer 2 (P2) is a free-standing polarizer from Microtech Instruments providing a large aperture but lower ER. P1 was set in front of the emitter with the passing direction parallel to the major polarization direction of the emitter to provide a perfect linear polarized light. P3 was 45° linear-polarized, which was parallel to the major detection direction of the detector to create an equal detection sensitivity on and signals. P2 acts as an analyzer to select the reflected or components.
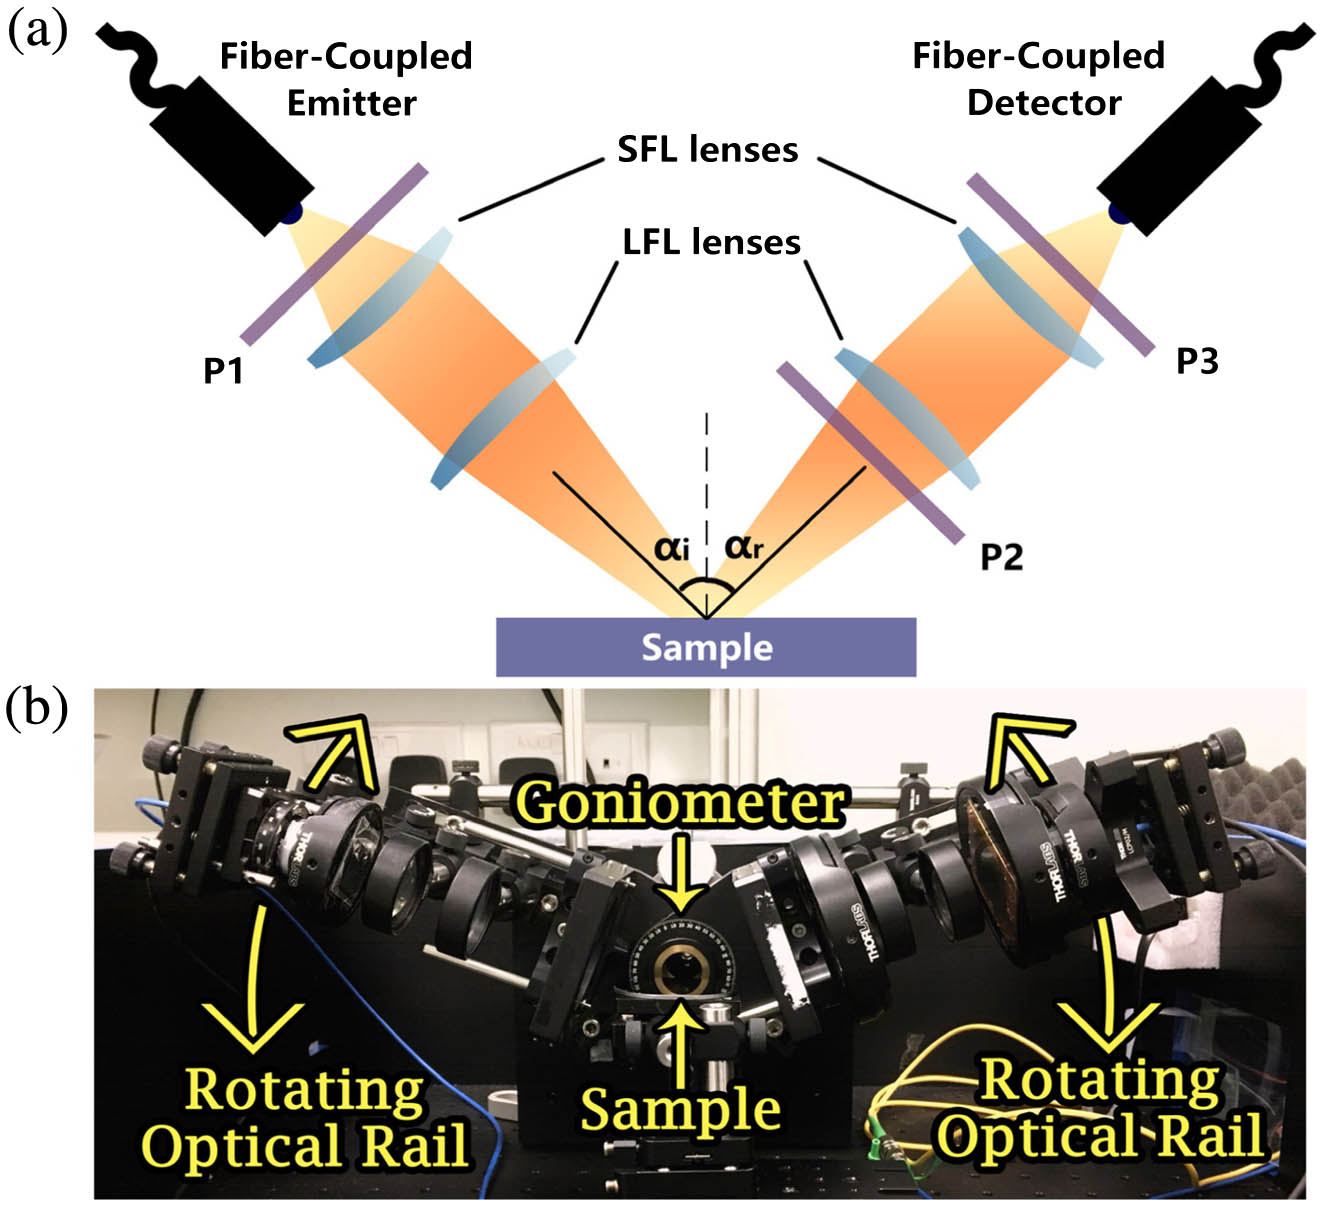
Figure 1.(a) Schematic diagram; (b) picture of the designed fiber-based THz-TDS ellipsometer.
Generally, P1 is set at 45° in a traditional ellipsometry measurement. However, this raises a high requirement on the orientation accuracy of P2. For example, when P2 is supposed to be set in the direction to detect the component, a small orientation error projects a comparable component to the passing direction, as the component is usually much weaker when incident close to the Brewster angle, resulting in a large error. In a manually aligned system, this is very likely to happen because there is no perfect reference direction in the system. By rotating P1 (always with the emitter) toward the direction, more weight is distributed to the component to reduce the contrast between the reflected and signals, as well as the error sensitivity. However, this also increases the error sensitivity on P1 due to the larger difference between the and signals output from P1. Therefore, there exists a function dependent on P1 orientation that balances the errors from P1 and P2. To derive the function, we use the theoretical reflection coefficient ratio . P1 is set at to the direction. When there is a small orientation error and on both P1 and P2, respectively, the resulting coefficient ratio becomes . represents the coefficient ratio with no error. The relative error (RE) can be calculated by where In a specific experiment, can be estimated from the sample properties or tested by when (it does not need to be very precise). A small value can be used for and to observe the error propagation. As an example here, and were used. RE as a function of is shown in Fig. 2.

Figure 2.RE as a function of when and .
By balancing the error propagated from P1 and P2, the best angle is found to be in this example. Figure 2 gives two pieces of important information. First, the coefficient ratio is highly sensitive to the orientation accuracy: a 0.5° error of P1 and P2 could propagate a 10.9% RE into a traditional setup. Second, from this function, we can reduce the error sensitivity down to 6.1% by simply rotating P1 to for the same orientation error level. This effective error analysis will later be applied for each measurement to minimize the error sensitivity.
4. CALIBRATION ALGORITHM
There are another two important errors in the measurement that need to be carefully calibrated. One is the pulse shift error that can occur in a fiber-based THz system [16,17]. THz pulse shifts at the femtosecond level could happen frequently in a fiber-based system, as fibers are highly sensitive to tiny temperature variations and vibrations. According to the Fourier transform, a 20 fs pulse shift, corresponding to about half of the time resolution in a general scan, induces 7.2° error at 1 THz. This may be ignored in a transmission measurement but has strong influence on reflection measurements due to the limited phase contrast. Another error factor comes from the limited ER of P2 (i.e., ). A perfect polarizer fully blocks the light in the blocking direction. However, the actual ER of a real device allows a certain amount of the field to pass through it. For convenience, in this work we call the amount of field able to pass through the device the “leakage.” Similar to the reason for the above orientation error, the small leakage of the component when detecting the signal could strongly affect the result due to the fact that the component is usually much stronger. We propose an effective algorithm to simultaneously compensate for these two errors. The core principle of the algorithm is based on interference theory: when the pulse shift error and the limited ER are correctly calibrated for the and components, the interference of their projections in another direction is exactly the same as the one we measure in that direction. The algorithm steps are shown as a flow chart in Fig. 3, and we will explain each step below.
Figure 3.Flow chart of the algorithm steps.
The transmission property of P2 in Step 1 is given by the ratio between the transmitted field from the blocking and passing directions of the polarizer, which is another representation of the ER. was characterized before any other measurements, but it only needs to be characterized once. The result is shown in Fig. 4. A positive relationship between the magnitude and the frequency is observed, which is a common characteristic of wire-grid polarizers. We can also verify that the imperfect ER could significantly affect the measurement at high frequencies. For example, the 0.05 transmission at 1 THz introduces 50% error to the detected component when . This leakage needs to be removed from the detection process to provide good accuracy.
Figure 4.Characterized as a function of frequency.
In the second step, three components (, , and ) are detected in an ellipsometry measurement. The additional component is measured in the direction with (in degree) to the direction, as shown in Fig. 5. This direction is selected where and have about equal projections, and where the projections destructively interfere with each other if available. will later be compared, with superimposed with the calibrated and to evaluate the calibration result.
Figure 5.Illustration of the E fields and the related directions considered in the algorithm.
The numerical data processing starts from Step 3. A pulse shift error between the measured and components is assumed to align the component by the equation in Step 3. The polarizer function is then used to calibrate the aligned signal for the limited ER by the equations in Step 4. The projections of the calibrated and components in the and directions are calculated using the geometric relationship equations in Step 5. The equations also consider the detection sensitivity of the and directions on the detector by the term. We also calculate the component in the direction because the measured component also includes some leakage from its perpendicular direction. The equation in Step 6 takes this effect into account by modeling the actual detected component with imperfect ER. The correct process of Steps 4–6 is based on the assumption that in Step 3 is given correctly. Otherwise, errors are propagated in every calculation and yield a wrong component. Therefore, the difference between the calibrated and measured components should reach the minimum value with the most accurate value. We use the equation in Step 7 to calculate their difference in the frequency region with good signal-to-noise ratio (SNR). One should notice that there could also be a pulse shift error between the measured component and the component. As we align the component to the component, this measured component should also be aligned. The equation in Step 7 subtracts the aligned component by assuming a value. Now the difference becomes a function of and . The correct pulse shift values and can be found at the minimum difference position, as shown in Step 8.
Finally, the corresponding calibrated and components and are output using the correct pulse shift for further calculating and .
The code of the algorithm, written in MATLAB, has been published on GitHub [34].
5. EXPERIMENTS
To evaluate the accuracy of the developed ellipsometer and the proposed algorithm, we first measured a standard high-resistivity Si (HR-Si) wafer. HR-Si has a very low absorption and dispersion in the 0.1–2 THz range; these properties can be precisely determined by transmission measurement and have been broadly studied by many groups [2,35]. Thus, there are sufficient and confident references for us to evaluate the accuracy of the ellipsometer. As the first example in this paper, we also introduce the measurement information needed for the application of our proposed algorithm.
A 2 inch HR-Si wafer with a thickness of 1970 μm was measured. The Brewster angle of about 73.7° can be calculated from the refractive index of 3.42. The ellipsometer was set to 70° incident to the sample. With sufficient sample area, the two LFL lenses were removed to leave the collimated beam radiating onto the sample. Under this incident angle, the estimated value was about 0.1. According to our sensitivity function, the emitter and P1 were both rotated to 18° to the direction to provide the lowest error sensitivity. The direction was then found at around 18° to the direction, where the projections of the and in this direction are about equal and destructively interfered. The reflected , , and directions were then detected in the ellipsometry measurement, as shown in Fig. 6(a).
Figure 6.(a) Measured , , (multiplied by a factor of 10) and the calibrated and , with the measured and calibrated zoom in the inset; (b) Diff as a function of pulse shift and ; (c) measured and calculated by the calibrated and .
The data processing was then conducted according to the algorithm in Steps 3–7. Pulse shift errors and were assumed to the measured and components. Polarizer calibration function was applied to the aligned signals. The difference between the calculated and measured electric fields in directions was calculated as Diff, as shown in Fig. 6(b). The figure shows a rapid color variation in the vertical direction, indicating a high sensitivity on . This provides the capability of accurately searching the correct value from the algorithm. The sensitivity on is low for the cases in which is almost frequency-independent and will be much better for dispersive samples. As marked on Fig. 6(b), the minimum Diff value was achieved at and . This shows that the algorithm is able to explore phase shift much smaller than the time resolution of the signal, which is 50 fs in this case. Such a high sensitivity is contributed by the interference principle and the fact that the phase is highly sensitive to the pulse position, especially in high-frequency regions. Figure 6(c) shows the corresponding calibrated and the measured one in frequency domain. Their difference was calculated and is plotted as the dashed gray curve in the figure. The intersections with the noise floor indicate that the algorithm has explored almost the best matching result that can be found theoretically within the dynamic range of the signal. Figure 6(a) also shows the calibrated and by the algorithm. As is much smaller than , a more obvious change between the calibrated and measured signals can be found on the component, showing the influence of the limited ER and the pulse shift error, as can be seen from the inset in Fig. 6(a).
The corresponding and by the calibrated and uncalibrated data were calculated and shown in Figs. 7(a) and 7(b). Reference values calculated from the transmission data were also given for evaluating the accuracy of the ellipsometry measurements. A 0.0088 average relative error for is achieved. This indicates a very high accuracy of the amplitude measurement, as a signal with 50 dB SNR (which is about the SNR of the detected signals) can have noise errors in this level, meaning that there is almost no contribution by other error factors. Compared to the uncalibrated result, the accuracy was significantly improved by the algorithm, as it subtracts the leaked signals from the data to calibrate the limited ER error. Figure 7(b) shows a 0.91° average relative error of . This is also a very promising accuracy in a fiber-based system. The major contribution of the improved accuracy comes from the precise 9.72 fs pulse alignment and also some from the polarizer calibration. The high-frequency data benefit most from this calibration. The refractive index and absorption coefficient were then calculated by solving Eq. (1) and are given in Figs. 7(c) and 7(d). The high-degree match with the transmission data demonstrates the accurate characterization. Compared to the Si ellipsometry measurement by Neshat and Armitage [27], a significant improvement in accuracy is achieved. It is important to notice that, for optically thick and transparent materials, it is very difficult to achieve the accuracy level of transmission by ellipsometry because the contrast induced by a single-surface reflection is very limited. On the contrary, transmission signals involve not only the interactions with the two sample surfaces, but also the phase change and energy loss during the penetration, providing a much better contrast. This, on the other hand, means that it could be used as a confident reference for examining the performance of the proposed ellipsometer and the algorithm. Next, we will see the superiority of ellipsometry on absorptive and conductive materials over transmission by the measurements of Glabervel glass and ITO thin film.
Figure 7.(a) ; (b) ; (c) refractive index; (d) absorption coefficient of HR-Si calculated by the calibrated and uncalibrated ellipsometry data, compared with the transmission results.
The characterization of highly absorptive solid samples has remained a challenge in the THz field for a long time. Most published work characterizes absorptive solids by transmission geometry but tends to stop at the frequency where the absorption coefficient exceeds about 80 to [1,36,37]. Traditional THz reflection spectroscopy has limited phase accuracy and is seldom reported. We show the power of ellipsometry for filling this gap by its reflection mechanism and self-reference principle. Glaverbel glass is a type of glass slide widely used for preparing biomedical samples and tissues. A 40 mm × 20 mm (width × length) and 1 mm thick Glaverbel glass slide was measured by ellipsometry at a 64° incident angle to achieve the best measurement sensitivity. In this measurement, the LFL lenses were used to generate a focused beam for adapting for the smaller sample size. The results were compared with the transmission data achieved by switching the system to transmission mode, with the corresponding error bars calculated from the noise level of the signals, as plotted in Fig. 8.
Figure 8.(a) Refractive index and (b) absorption coefficient of Glaverbel glass characterized by ellipsometry and transmission.
The figure shows a vastly improved accuracy above 1 THz for ellipsometry compared to transmission. Consistent with other publications, the transmission data immediately lose accuracy when the absorption coefficient reaches about . The error bars of the transmission data significantly increased after this, demonstrating poor reliability. On the other hand, the sample absorption only induces signal phase change in ellipsometry and has no effect on the signal intensity. The error bars remained small for the whole effective frequency range. The absorption coefficient as high as was successfully characterized. The refractive index decreases with increasing frequency, which is a resonable chracteristic for a glass [37].
As reported by Yamashita et al., ellipsometry has also been successfully applied for conductive thin-film measurements [25]. In our work, to demonstrate the versatility of our approach, a 60.4 nm conductive ITO thin film deposited on a 500 μm thick crystal quartz substrate was also measured. The thickness of the ITO layer was accurately determined by the optical ellipsometer working in a range from 0.7 eV to 6.4 eV. The THz ellipsometer measured the sample at a 66° incident angle. The complex refractive index of the ITO layer was determined by fitting data to the measured and based on a trilayer optical model. The resulting complex refractive index and complex optical conductivity are shown as the circles in Fig. 9. The complex conductivity is calculated by where is taken from Ref. [38]. The results agree well with the transmission data from Yang et al. [39,40] and the ellipsometry measurement by Yamashita et al. [25], indicating excellent accuracy. To reveal the physical properties, the Drude model is fitted to the experimental data [40]. The fittings to the complex conductivity and the complex refractive index are shown as the solid curves in Fig. 9. Considering the SNR, the data between 0.2 and 1.6 THz were fitted, and a perfect match with the model was achieved. The almost frequency-independent real conductivity and slightly increasing imaginary conductivity agree very well with the Drude behavior far below the plasma frequency. The fitting results are much better than those presented in Refs. [25,39–41]. Although the properties of ITO can depend on the sample thickness and the fabrication techniques [39–41], the extracted model parameters in this work can still be found in a very reasonable range. The charge density of highly agrees with the value of in Ref. [25]. The plasma frequency and momentum relaxation time also match well with published values [41]. Compared to transmission, ellipsometry has a great advantage on conductive thin-film samples. Taking the sample here as an example, the phase change by the 60.4 nm ITO layer in transmission is less than 1°. This requires the phase-detection accuracy to be much better than 1°. This requires pulse sampling position error far smaller than 1 fs, and substrate thickness difference between the sample and the reference is far less than 150 nm. Both are very difficult to achieve in a transmission measurement. Therefore, transmission is measured with a much thicker layer, which will obviously decrease the SNR and limit the exploration on the properties of thinner samples. Compared to that, the phase contrast in ellipsometry measurement is greatly enhanced by its reflection mechanism. The self-reference principle requires no external reference and therefore no phase error induced by substrate thickness variation. The ITO sample characterized in this work is the thinnest one compared to the above references and could be even much thinner. In short, we achieve a much more confident result compared to transmission.
Figure 9.Complex refractive index and complex conductivity of thin-film ITO. The circles are the experimental data, and the solid curves are the Drude-model fitting results by the data in the yellow region.
6. CONCLUSIONS
In this work, we developed a fiber-based THz ellipsometer with a high flexibility on the incident angle that can be freely rotated from 45° to transmission, providing an excellent robustness on samples with different properties. An error-analysis function was introduced to effectively determine the optimized orientation for P1 to minimize the error sensitivity. A calibration algorithm, which precisely compensates both the limited ER error and the pulse shift error, was also proposed for accurate data processing. A standard Si wafer was first measured to evaluate the performance of the developed ellipsometer and the algorithm. A greatly improved accuracy was found compared to the state of art. A highly absorptive Glaverbel glass, and a crystal quartz substrate with a thin-film ITO layer, were also measured to show the superiority of ellipsometry over transmission on opaque samples. The promising results demonstrate the accuracy achieved by the flexible and precise control of the ellipsometer, as well as the accurate calibration by the algorithm. The work demonstrates a perfect solution for accurate THz reflection measurements. It is a versatile technique for sample characterizations in the THz region.
References
[1] M. Naftaly, R. E. Miles. Terahertz time-domain spectroscopy for material characterization. Proc. IEEE, 95, 1658-1665(2007).
[2] D. Grischkowsky, S. Keiding, M. van Exter, C. Fattinger. Far-infrared time-domain spectroscopy with terahertz beams of dielectrics and semiconductors. J. Opt. Soc. Am. B, 7, 2006-2015(1990).
[3] Y. Jin, G. Kim, S. Jeon. Terahertz dielectric properties of polymers. J. Korean Phys. Soc., 49, 513-517(2006).
[4] P. D. Cunningham, N. N. Valdes, F. A. Vallejo, L. M. Hayden, B. Polishak, X. H. Zhou, J. Luo, A. K. Y. Jen, J. C. Williams, R. J. Twieg. Broadband terahertz characterization of the refractive index and absorption of some important polymeric and organic electro-optic materials. J. Appl. Phys., 109, 043505(2011).
[5] L. Thrane, R. H. Jacobsen, P. U. Jepsen, S. R. Keiding. Chemical THz reflection spectroscopy of liquid water. Chem. Phys. Lett., 240, 330-333(1995).
[6] J. T. Kindt, C. A. Schmuttenmaer. Far-infrared dielectric properties of polar liquids probed by femtosecond terahertz pulse spectroscopy. J. Phys. Chem., 100, 10373-10379(1996).
[7] E. Pickwell, A. J. Fitzgerald, B. E. Cole, P. F. Taday, R. J. Pye, T. Ha, M. Pepper, V. P. Wallace. Simulating the response of terahertz radiation to basal cell carcinoma using ex vivo spectroscopy measurements. J. Biomed. Opt., 10, 064021(2005).
[8] S. Fan, B. S. Y. Ung, E. P. J. Parrott, V. P. Wallace, E. Pickwell-Macpherson. In vivo terahertz reflection imaging of human scars during and after the healing process. J. Biophoton., 10, 1143-1151(2016).
[9] Y. He, B. S.-Y. Ung, E. P. J. Parrott, A. T. Ahuja, E. Pickwell-MacPherson. Freeze-thaw hysteresis effects in terahertz imaging of biomedical tissues. Biomed. Opt. Express, 7, 4711-4717(2016).
[10] P. U. Jepsen, B. M. Fischer, A. Thoman, H. Helm, J. Y. Suh, R. Lopez, R. F. Haglund. Metal-insulator phase transition in a VO2 thin film observed with terahertz spectroscopy. Phys. Rev. B, 74, 205103(2006).
[11] P. A. George, J. Strait, J. Dawlaty, S. Shivaraman, M. Chandrashekhar, F. Rana, M. G. Spencer. Ultrafast optical-pump terahertz-probe spectroscopy of the carrier relaxation and recombination dynamics in epitaxial graphene. Nano Lett., 8, 4248-4251(2008).
[12] A. Pashkin, M. Kempa, H. Němec, F. Kadlec, P. Kužel. Phase-sensitive time-domain terahertz reflection spectroscopy. Rev. Sci. Instrum., 74, 4711-4717(2003).
[13] S. Nashima, O. Morikawa, K. Takata, M. Hangyo. Measurement of optical properties of highly doped silicon by terahertz time domain reflection spectroscopy. Appl. Phys. Lett., 79, 3923-3925(2001).
[14] E. M. Vartiainen, Y. Ino, R. Shimano, M. Kuwata-Gonokami, Y. P. Svirko, K. E. Peiponen. Numerical phase correction method for terahertz time-domain reflection spectroscopy. J. Appl. Phys., 96, 4171-4175(2004).
[15] V. Lucarini, Y. Ino, K. E. Peiponen, M. Kuwata-Gonokami. Detection and correction of the misplacement error in terahertz spectroscopy by application of singly subtractive Kramers-Kronig relations. Phys. Rev. B, 72, 3-8(2005).
[16] X. Chen, E. P. J. Parrott, B. S.-Y. Ung, E. Pickwell-MacPherson. A robust baseline and reference modification and acquisition algorithm for accurate THz imaging. IEEE Trans. Terahertz Sci. Technol., 7, 493-501(2017).
[17] S. Fan, E. P. J. Parrott, B. S. Y. Ung, E. Pickwell-MacPherson. Calibration method to improve the accuracy of THz imaging and spectroscopy in reflection geometry. Photon. Res., 4, A29-A35(2016).
[18] H. Hirori, K. Yamashita, M. Nagai, K. Tanaka. Attenuated total reflection spectroscopy in time domain using terahertz coherent pulses. Jpn. J. Appl. Phys., 43, L1287-L1289(2004).
[19] Y. Ogawa, L. Cheng, S. Hayashi, K. Fukunaga. Attenuated total reflection spectra of aqueous glycine in the terahertz region. IEICE Electron. Express, 6, 117-121(2009).
[20] S. Y. Huang, Y. X. J. Wang, D. K. W. Yeung, A. T. Ahuja, Y.-T. Zhang, E. Pickwell-MacPherson. Tissue characterization using terahertz pulsed imaging in reflection geometry. Phys. Med. Biol., 54, 149-160(2009).
[21] S. Huang, P. C. Ashworth, K. W. C. Kan, Y. Chen, V. P. Wallace, Y. Zhang, E. Pickwell-MacPherson. Improved sample characterization in terahertz reflection imaging and spectroscopy. Opt. Express, 17, 3848-3854(2009).
[22] H. Fujiwara. Spectroscopic Ellipsometry Principles and Applications(2007).
[23] T. Hofmann, C. M. Herzinger, A. Boosalis, T. E. Tiwald, J. A. Woollam, M. Schubert. Variable-wavelength frequency-domain terahertz ellipsometry. Rev. Sci. Instrum., 81, 023101(2010).
[24] T. Nagashima, M. Hangyo. Measurement of complex optical constants of a highly doped Si wafer using terahertz ellipsometry. Appl. Phys. Lett., 79, 3917-3919(2001).
[25] M. Yamashita, H. Takahashi, T. Ouchi, C. Otani. Ultra-broadband terahertz time-domain ellipsometric spectroscopy utilizing GaP and GaSe emitters and an epitaxial layer transferred photoconductive detector. Appl. Phys. Lett., 104, 051103(2014).
[26] N. Matsumoto, T. Hosokura, T. Nagashima, M. Hangyo. Measurement of the dielectric constant of thin films by terahertz time-domain spectroscopic ellipsometry. Opt. Lett., 36, 265-267(2011).
[27] M. Neshat, N. Armitage. Terahertz time-domain spectroscopic ellipsometry: instrumentation and calibration. Opt. Express, 20, 29063-29075(2012).
[28] X. Chen, E. P. J. Parrott, P. Tekavec, E. Pickwell-MacPherson. A novel method for accurate THz ellipsometry. 42nd International Conference on Infrared, Millimeter, and Terahertz Waves (IRMMW-THz), 1-2(2017).
[29] A. Soltani, D. Jahn, L. Duschek, E. Castro-Camus, M. Koch, W. Withayachumnankul. Attenuated total reflection terahertz time-domain spectroscopy: uncertainty analysis and reduction scheme. IEEE Trans. Terahertz Sci. Technol., 6, 32-39(2016).
[30] I. Pupeza, R. Wilk, M. Koch. Highly accurate optical material parameter determination with THz time-domain spectroscopy. Opt. Express, 15, 4335-4350(2007).
[31] T. D. Dorney, R. G. Baraniuk, D. M. Mittleman. Material parameter estimation with terahertz time-domain spectroscopy. J. Opt. Soc. Am. A, 18, 1562-1571(2001).
[32] H. El Rhaleb, N. Cella, J. P. Roger, D. Fournier, A. C. Boccara, A. Zuber. Beam size and collimation effects in spectroscopic ellipsometry of transparent films with optical thickness inhomogeneity. Thin Solid Films, 288, 125-131(1996).
[33] Z. Huang, E. P. J. Parrott, H. Park, H. P. Chan, E. Pickwell-MacPherson. High extinction ratio and low transmission loss thin-film terahertz polarizer with a tunable bilayer metal wire-grid structure. Opt. Lett., 39, 793-796(2014).
[34] X. Chen. THz-ellipsometry-algorithm.
[35] J. Dai, J. Zhang, W. Zhang, D. Grischkowsky. Terahertz time-domain spectroscopy characterization of the far-infrared absorption and index of refraction of high-resistivity, float-zone silicon. J. Opt. Soc. Am. B, 21, 1379-1386(2004).
[36] M. Naftaly, R. E. Miles. Terahertz time-domain spectroscopy of silicate glasses and the relationship to material properties. J. Appl. Phys., 102, 043517(2007).
[37] M. Zalkovskij, C. Zoffmann Bisgaard, A. Novitsky, R. Malureanu, D. Savastru, A. Popescu, P. Uhd Jepsen, A. V. Lavrinenko. Ultrabroadband terahertz spectroscopy of chalcogenide glasses. Appl. Phys. Lett., 100, 031901(2012).
[38] I. Hamberg, C. G. Granqvist. Evaporated Sn-doped In2O3 films: basic optical properties and applications to energy-efficient windows. J. Appl. Phys., 60, R123-R160(1986).
[39] C. Yang, C. Chang, P. Chen, P. Yu. Broadband terahertz conductivity and optical transmission of indium-tin-oxide (ITO) nanomaterials. Opt. Express, 21, 16670-16682(2013).
[40] T. Wang, M. Zalkovskij, K. Iwaszczuk, A. V. Lavrinenko, G. V. Naik, J. Kim, A. Boltasseva, P. U. Jepsen. Ultrabroadband terahertz conductivity of highly doped ZnO and ITO. Opt. Mater. Express, 5, 566-575(2015).
[41] C. Chen, Y. Lin, C. Chang, P. Yu, J. Shieh, C. Pan, S. Member. Frequency-dependent complex conductivities and dielectric responses of indium tin oxide thin films from the visible to the far-infrared. IEEE J. Quantum Electron., 46, 1746-1754(2010).


