• Photonics Research
  • Vol. 9, Issue 12, 2501 (2021)
Chen Bai1、†, Tong Peng1、2、†, Junwei Min1, Runze Li1, Yuan Zhou1, and Baoli Yao1、3、*
Author Affiliations
  • 1State Key Laboratory of Transient Optics and Photonics, Xi’an Institute of Optics and Precision Mechanics, Chinese Academy of Sciences, Xi’an 710119, China
  • 2Xi’an Jiaotong University, Xi’an 710049, China
  • 3Pilot National Laboratory for Marine Science and Technology (Qingdao), Qingdao 266200, China
  • show less
    DOI: 10.1364/PRJ.441054 Cite this Article Set citation alerts
    Chen Bai, Tong Peng, Junwei Min, Runze Li, Yuan Zhou, Baoli Yao. Dual-wavelength in-line digital holography with untrained deep neural networks[J]. Photonics Research, 2021, 9(12): 2501 Copy Citation Text show less
    Schematic of the DIDH-Net imaging system. A captured hologram IcapRGB(z=d) of a phase object is the input to the neural networks after extracting holograms at each wavelength. The output of the neural networks is taken as the estimated phase Φestm(z=0), which is then numerically propagated to simulate the diffraction and measurement processes HDIDHm,z{·} to generate Iestm(z=d). The mean square errors (MSEs) between Icapm(z=d) and Iestm(z=d) are measured as the loss value to adjust the neural network parameters. The optical thickness distribution L can finally be acquired with the suppressed amplified noises and the free twin-image.
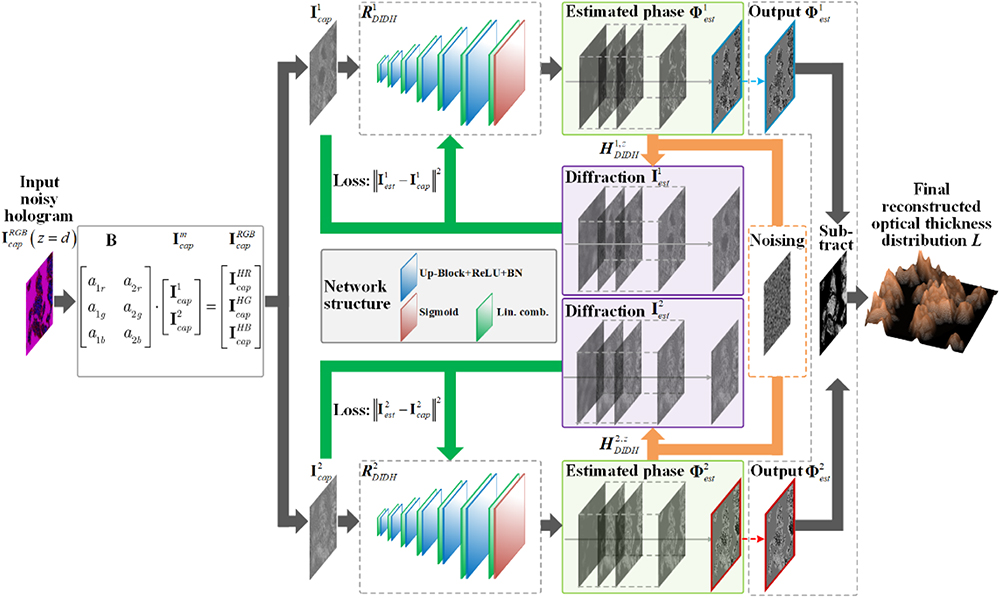
    Fig. 1. Schematic of the DIDH-Net imaging system. A captured hologram IcapRGB(z=d) of a phase object is the input to the neural networks after extracting holograms at each wavelength. The output of the neural networks is taken as the estimated phase Φestm(z=0), which is then numerically propagated to simulate the diffraction and measurement processes HDIDHm,z{·} to generate Iestm(z=d). The mean square errors (MSEs) between Icapm(z=d) and Iestm(z=d) are measured as the loss value to adjust the neural network parameters. The optical thickness distribution L can finally be acquired with the suppressed amplified noises and the free twin-image.
    Simulation results of the numerical phase target for the single-shot DIDH. (a) The simulated optical thickness distribution of the object. (b) The simulated single-shot recorded dual-wavelength in-line hologram calculated at z=10 mm. (c) and (d) are the extracted single-wavelength holograms from (b). The white scale bar measures 200 μm.
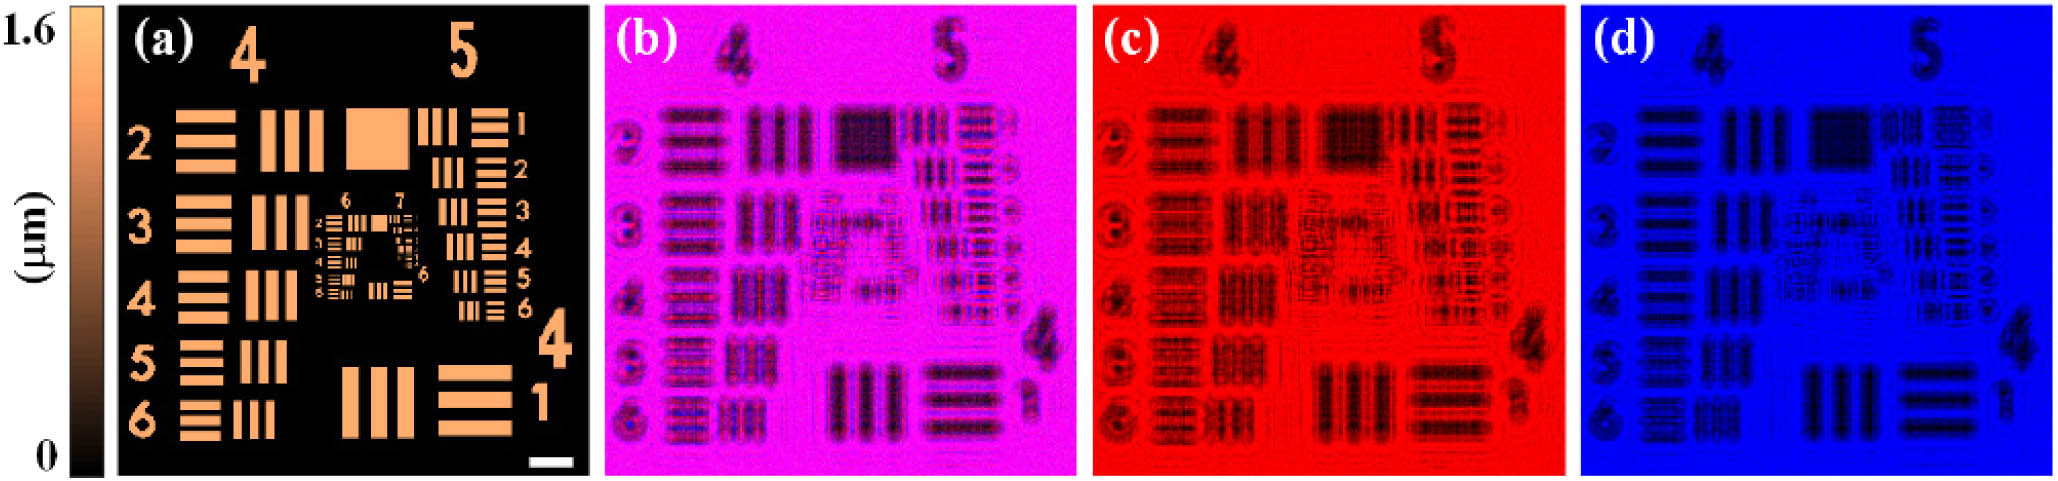
    Fig. 2. Simulation results of the numerical phase target for the single-shot DIDH. (a) The simulated optical thickness distribution of the object. (b) The simulated single-shot recorded dual-wavelength in-line hologram calculated at z=10  mm. (c) and (d) are the extracted single-wavelength holograms from (b). The white scale bar measures 200 μm.
    Comparison of the different phase retrieval methods (from left column to right column): the ground-truth images for intuitive comparison, the phase maps reconstructed by means of direct reconstruction via backpropagation, the CS-DH method, the end-to-end net with the pre-trained network, the deep DIH, the RED frame, and the DIDH-Net. The cross-section optical thickness profiles (along the red line) of each optical thickness map were also measured and are shown in the last row.
    Fig. 3. Comparison of the different phase retrieval methods (from left column to right column): the ground-truth images for intuitive comparison, the phase maps reconstructed by means of direct reconstruction via backpropagation, the CS-DH method, the end-to-end net with the pre-trained network, the deep DIH, the RED frame, and the DIDH-Net. The cross-section optical thickness profiles (along the red line) of each optical thickness map were also measured and are shown in the last row.
    Effect of the diffraction distance z on the quality of the reconstructed image. The diffraction holograms [top row (a1)–(d1)] were calculated at z values of 1 mm, 10 mm, 25 mm, and 50 mm, each of which followed their DIDH-Net reconstructed single-wavelength phase images and optical thickness maps in the corresponding rows. The ground truths of images are listed [far right column (f1)–(f3)] under the evolution of the MSE with an increasing number of epochs [top right corner (e)]. The scale bar measures 200 μm.
    Fig. 4. Effect of the diffraction distance z on the quality of the reconstructed image. The diffraction holograms [top row (a1)–(d1)] were calculated at z values of 1 mm, 10 mm, 25 mm, and 50 mm, each of which followed their DIDH-Net reconstructed single-wavelength phase images and optical thickness maps in the corresponding rows. The ground truths of images are listed [far right column (f1)–(f3)] under the evolution of the MSE with an increasing number of epochs [top right corner (e)]. The scale bar measures 200 μm.
    Reconstructions for the different noise levels: (a1) and (a2) the noise-free hologram at z=10 mm. The DIDH-Net reconstructed optical thickness maps along with the corresponding results with noise levels of (b1) and (b2) σ=0.22, (c1) and (c2) σ=0.30, and (d1) and (d2) σ=0.38. The PSNRs and SSIMs of the optical thickness maps computed against the noise-free ones were also evaluated. The scale bar measures 200 μm.
    Fig. 5. Reconstructions for the different noise levels: (a1) and (a2) the noise-free hologram at z=10  mm. The DIDH-Net reconstructed optical thickness maps along with the corresponding results with noise levels of (b1) and (b2) σ=0.22, (c1) and (c2) σ=0.30, and (d1) and (d2) σ=0.38. The PSNRs and SSIMs of the optical thickness maps computed against the noise-free ones were also evaluated. The scale bar measures 200 μm.
    Schematic of the experimental setup of the DIDH.
    Fig. 6. Schematic of the experimental setup of the DIDH.
    Experimental images of the rectangular phase-step [top row (a1)–(e1)] and micro-lens [second row (a2)–(e2)] processed with the backpropagation, the CS, the RED, and the DIDH-Net methods, respectively. The cross-section optical thickness profiles (along the dashed line) were also measured in insets. The scale bars measure 30 μm.
    Fig. 7. Experimental images of the rectangular phase-step [top row (a1)–(e1)] and micro-lens [second row (a2)–(e2)] processed with the backpropagation, the CS, the RED, and the DIDH-Net methods, respectively. The cross-section optical thickness profiles (along the dashed line) were also measured in insets. The scale bars measure 30 μm.
    Imaging results of (a) Ascaris eggs and (b) water flea jumping foot by different methods, including the final reconstructed phase maps and their corresponding optical thickness maps.
    Fig. 8. Imaging results of (a) Ascaris eggs and (b) water flea jumping foot by different methods, including the final reconstructed phase maps and their corresponding optical thickness maps.
     BackpropagationCS-DHEnd-to-End NetDeep DIHREDDIDH-Net
    PSNR/dB18.5919.3222.4924.3227.5031.36
    SSIM0.680.730.770.810.850.91
    Table 1. Quantitative Results on Imaging with Different Methods
    Chen Bai, Tong Peng, Junwei Min, Runze Li, Yuan Zhou, Baoli Yao. Dual-wavelength in-line digital holography with untrained deep neural networks[J]. Photonics Research, 2021, 9(12): 2501
    Download Citation