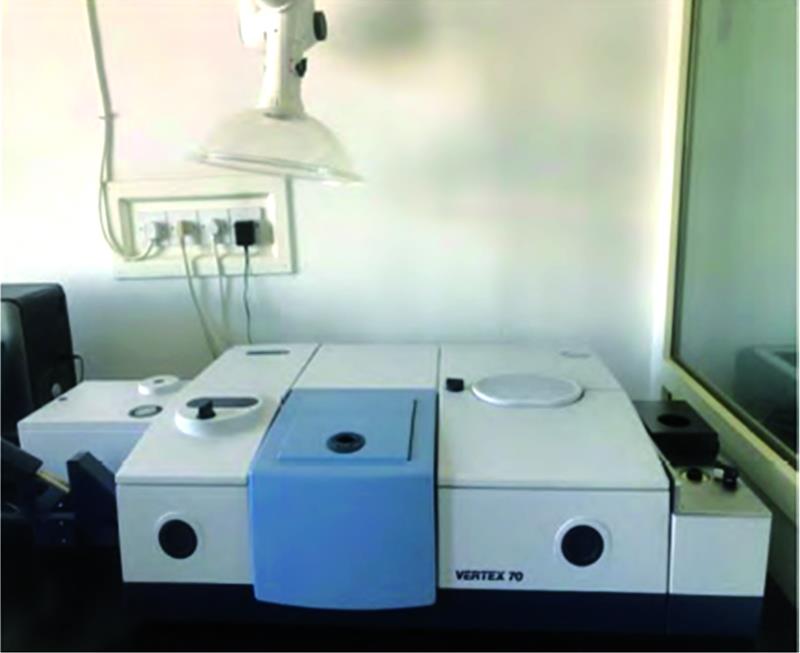
Fig. 1. Vertex70 Fourier transform infrared spectrometer
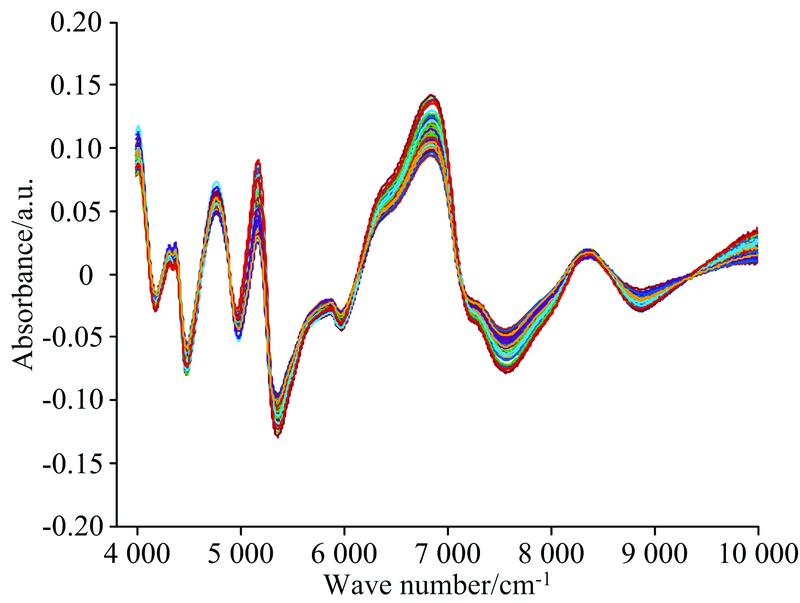
Fig. 2. NIR spectra of the SG+Detrend method
Fig. 3. NIR spectra of the Detrend method
Fig. 4. SG+Detrend_SPA_PLSR method for the prediction results of protein
Fig. 5. Detrend_SPA_PLSR method for the prediction results of polysaccharide
Fig. 6. SOM neural network structure of protein and polysaccharide
Fig. 7. RBF network topology of protein and polysaccharide
Fig. 8. SOM-RBF prediction algorithm flow chart for protein and polysaccharide
[10] Fig. 9. SOM-RBF network prediction results of protein
Fig. 10. SOM-RBF network prediction results of polysaccharide
营养 物质 | 样本集 | 样本 个数 | 最小值 g/100 g | 最大值 g/100 g | 平均值 g/100 g | 标准 偏差 |
---|
蛋白质 | 建模集 | 45 | 4.93 | 14.20 | 9.42 | 1.86 | 预测集 | 14 | 4.93 | 12.10 | 9.61 | 1.82 | 多糖 | 建模集 | 45 | 16.78 | 32.57 | 21.86 | 3.16 | 预测集 | 14 | 17.35 | 29.65 | 21.64 | 3.57 |
|
Table 1. Basic statistics of Lanzhou lily samples
处理参数 | 预处理方法 | Rc | RMSEC | Rv | RMSECV | Rp | RMSEP |
---|
蛋白质 | None | 0.824 8 | 0.910 7 | 0.706 0 | 1.157 9 | 0.771 8 | 1.424 4 | SG | 0.824 1 | 0.912 3 | 0.705 9 | 1.158 0 | 0.771 7 | 1.424 3 | Normalize | 0.895 3 | 0.719 6 | 0.835 5 | 0.891 8 | 0.846 8 | 1.130 5 | SNV | 0.864 2 | 0.850 7 | 0.748 4 | 1.134 6 | 0.848 6 | 0.992 5 | MSC | 0.801 8 | 0.920 8 | 0.666 5 | 1.163 6 | 0.759 0 | 1.212 4 | Detrend | 0.849 9 | 0.912 7 | 0.778 2 | 1.094 2 | 0.822 4 | 1.256 1 | OSC | 0.996 0 | 0.166 9 | 0.870 5 | 0.917 0 | 0.346 2 | 1.890 6 | SG+1D | 0.965 0 | 0.461 7 | 0.672 2 | 1.307 8 | 0.778 1 | 1.181 2 | SG+Normalize | 0.808 6 | 1.046 3 | 0.693 2 | 1.294 7 | 0.796 9 | 1.221 9 | SG+SNV | 0.749 4 | 1.067 1 | 0.599 7 | 1.306 8 | 0.814 2 | 1.138 1 | SG+Detrend | 0.915 3 | 0.699 4 | 0.827 5 | 0.989 0 | 0.870 1 | 1.081 1 |
|
Table 2. PLSR modeling results of Lanzhou lily protein using the spectra pretreated by different methods
处理参数 | 预处理方法 | Rc | RMSEC | Rv | RMSECV | Rp | RMSEP |
---|
多糖 | None | 0.888 9 | 1.446 8 | 0.770 4 | 2.038 6 | 0.777 0 | 2.317 5 | SG | 0.887 4 | 1.455 8 | 0.771 1 | 2.036 9 | 0.777 0 | 2.316 8 | Normalize | 0.877 8 | 1.512 5 | 0.736 2 | 2.181 8 | 0.740 7 | 2.438 6 | SNV | 0.926 7 | 1.186 7 | 0.826 1 | 1.787 5 | 0.949 6 | 1.623 2 | MSC | 0.941 0 | 0.919 8 | 0.833 7 | 1.511 3 | 0.901 8 | 1.648 8 | Detrend | 0.966 7 | 0.697 3 | 0.903 1 | 1.171 7 | 0.921 6 | 1.692 1 | OSC | 0.999 3 | 0.117 0 | 0.966 6 | 0.809 8 | 0.835 9 | 2.131 1 | SG+1D | 0.953 6 | 0.941 7 | 0.518 3 | 2.696 6 | 0.452 2 | 1.241 4 | SG+Normalize | 0.917 9 | 1.225 2 | 0.838 8 | 1.690 2 | 0.632 1 | 2.819 4 | SG+SNV | 0.946 5 | 0.877 3 | 0.850 2 | 1.438 7 | 0.914 3 | 1.611 4 | SG+Detrend | 0.933 2 | 1.135 0 | 0.846 6 | 1.688 1 | 0.909 8 | 1.914 7 |
|
Table 3. PLSR modeling results of Lanzhou lily polysaccharide using the spectra pretreated by different methods
处理参数 | 预处理 | 特征提取法 | 特征波长数 | Rc | RMSEC | Rv | RMSECV | Rp | RMSEP |
---|
蛋白质 | SG+Detrend | None | 831 | 0.915 3 | 0.699 4 | 0.825 7 | 0.989 0 | 0.870 1 | 1.081 1 | SG+Detrend | CARS | 4 | 0.882 6 | 0.774 8 | 0.846 7 | 0.880 8 | 0.867 2 | 1.144 9 | SG+Detrend | SPA | 2 | 0.884 5 | 0.722 8 | 0.853 8 | 0.807 6 | 0.810 6 | 1.195 3 | SG+Detrend | PCA | 3 | 0.787 5 | 1.084 1 | 0.741 5 | 1.180 4 | 0.816 4 | 1.218 3 | 多糖 | Detrend | None | 831 | 0.966 7 | 0.697 3 | 0.903 1 | 1.171 7 | 0.921 6 | 1.692 1 | Detrend | CARS | 13 | 0.929 1 | 1.000 1 | 0.874 4 | 1.329 3 | 0.885 1 | 1.668 1 | Detrend | SPA | 14 | 0.967 8 | 0.632 7 | 0.920 3 | 0.988 6 | 0.810 9 | 2.094 6 | Detrend | PCA | 3 | 0.737 2 | 1.896 2 | 0.501 5 | 2.487 7 | 0.225 3 | 4.402 6 |
|
Table 4. Comparison of PLSR modeling results based on CARS, SPA and PCA methods
营养物质 | 预测方法 | Rp | RMSEP |
---|
蛋白质 | PLSR | 0.810 6 | 1.195 3 | SOM-RBF | 0.866 6 | 1.038 5 | 多糖 | PLSR | 0.810 9 | 2.094 6 | SOM-RBF | 0.868 1 | 1.799 4 |
|
Table 5. Comparison of modeling results between PLSR and SOM-RBF prediction models