
Quan Xu, Xiaoqiang Su, Xueqian Zhang, Lijuan Dong, Lifeng Liu, Yunlong Shi, Qiu Wang, Ming Kang, Andrea Alù, Shuang Zhang, Jiaguang Han, Weili Zhang, "Mechanically reprogrammable Pancharatnam–Berry metasurface for microwaves," Adv. Photon. 4, 016002 (2022)
- Advanced Photonics
- Vol. 4, Issue 1, 016002 (2022)
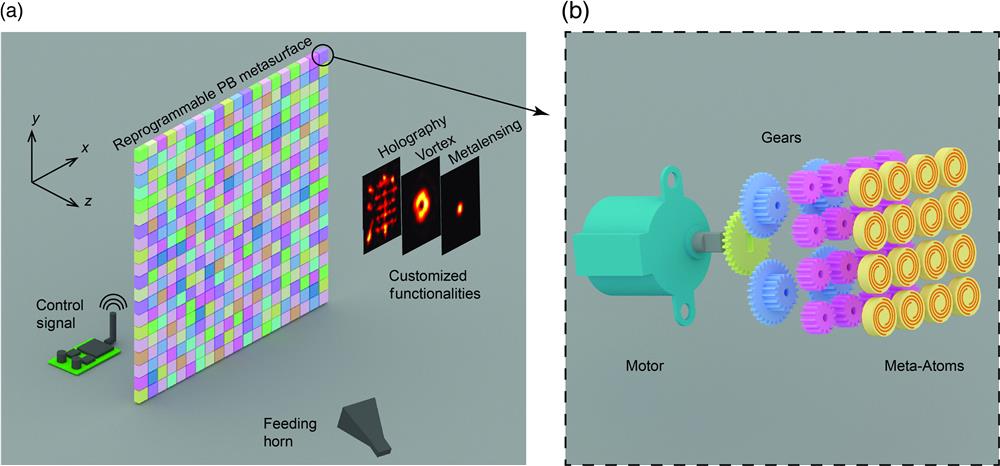
Fig. 1. Schematics of the metasurface and its supercell. (a) The metasurface is formed by an array of supercells, arranged in a square lattice with a period of 43.5 mm. The PB phase response of each supercell is controlled by an addressable wireless signal and can be independently tuned over 28 phase levels. The metasurface can be reprogrammed to realize custom functionalities including metalensing, focused vortex beam generation, and holographic imaging by a proper design of the PB phase distribution. (b) The PB phase control in each supercell is achieved by transmitting the torque from a stepping motor to the PB meta-atoms through a set of gears.
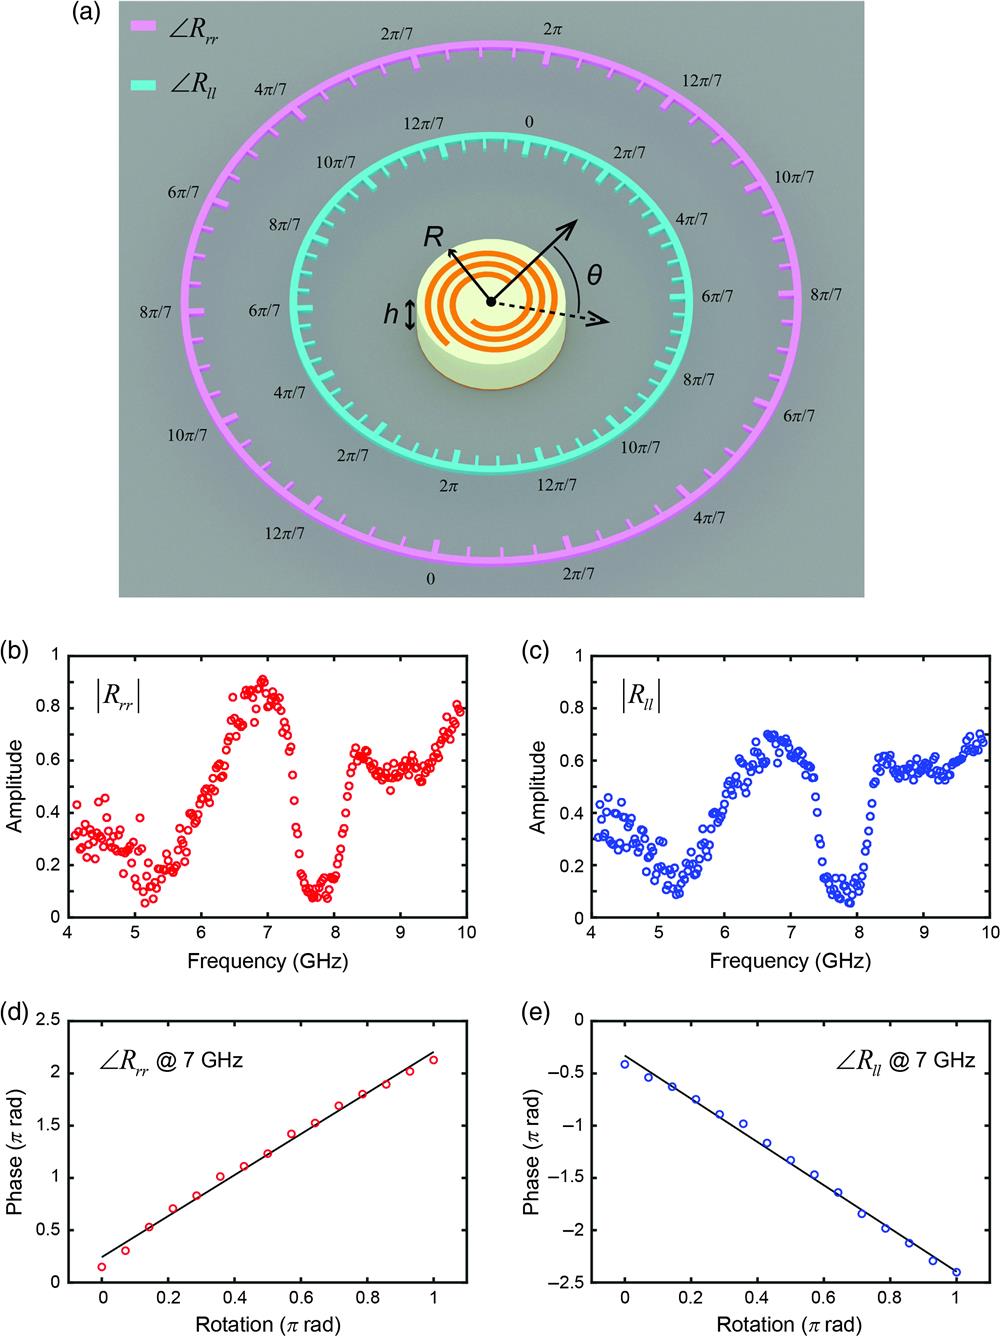
Fig. 2. PB phase response. (a) The top portion of the PB meta-atom is a pair of Archimedean spirals with the same geometric parameters: inner radius (1.9 mm), outer radius (4.3 mm), height (0.035 mm), width (0.4 mm), and number of turns (two turns). The pink and sky-blue dials schematically depict the PB phase control resolution and variation gradients for
Fig. 3. Realization of metalensing. (a), (d), (g) Required rotation profiles to realize different metalens operations for RCP waves. (b), (e), (h) Measured electric field intensities (
Fig. 4. Focused vortex beam generation. (a), (e), (i), (m) Required rotation profiles to generate focused vortex beams with the topological charges of
Fig. 5. Holographic imaging. (a)–(d), (i)–(l) Required rotation profiles to generate holographic images of Chinese characters “天津大学” (Tianjin University) and “大同云冈” (Datong Yungang), respectively. (e)–(h), (m)–(p) Corresponding measured electric field intensities (


Set citation alerts for the article
Please enter your email address

© Copyright 2018-2021 | Chinese Laser Press. All Rights Reserved 沪ICP备15018463号-20