• Chinese Optics Letters
  • Vol. 14, Issue 6, 062502 (2016)
Xiang Li and Degang Zhao*
Author Affiliations
  • State Key Laboratory on Integrated Optoelectronics, Institute of Semiconductors, Chinese Academy of Sciences, Beijing 100083, China
  • show less
    DOI: 10.3788/COL201614.062502 Cite this Article Set citation alerts
    Xiang Li, Degang Zhao. Effectiveness of inserting an InGaN interlayer to improve the performances of InGaN-based blue-violet laser diodes[J]. Chinese Optics Letters, 2016, 14(6): 062502 Copy Citation Text show less
    Schematic diagrams of (a) the Ref. LD and (b) the New LD structures with ridge waveguides.
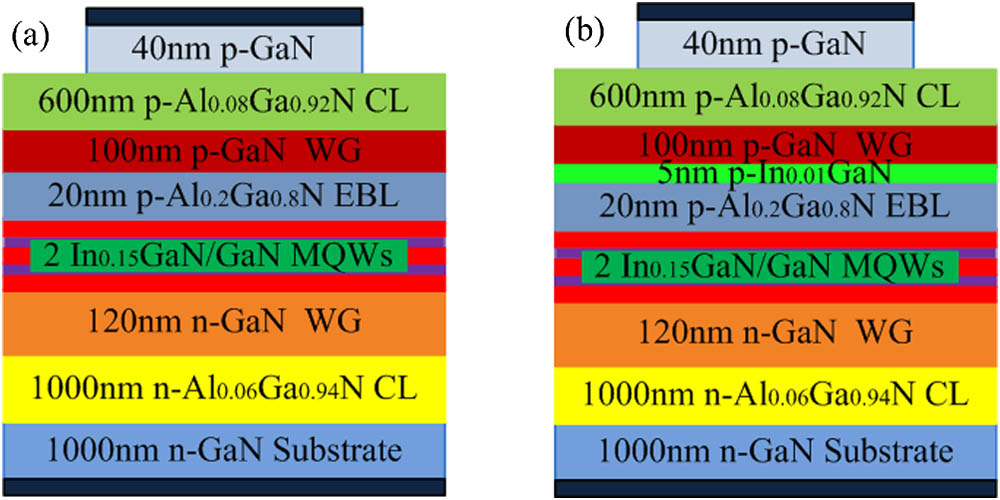
    Fig. 1. Schematic diagrams of (a) the Ref. LD and (b) the New LD structures with ridge waveguides.
    Output power and voltage versus current of the Ref. LD (black) and the New LD (red).
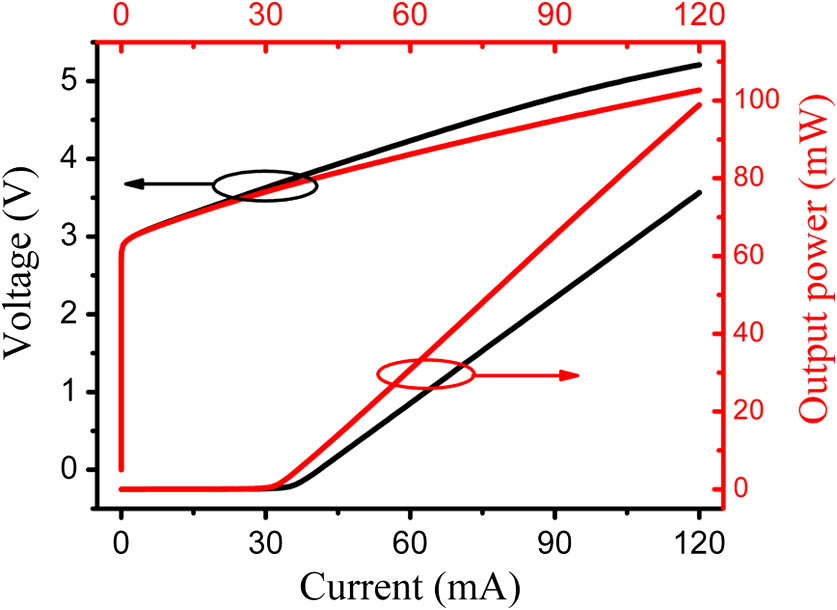
    Fig. 2. Output power and voltage versus current of the Ref. LD (black) and the New LD (red).
    Energy band diagrams of (a) the Ref. LD and (b) the New LD structures (black lines) at 120 mA. Symbols + and − represent positive and negative polarization charges. The red lines mark the quasi-Fermi levels Efn and Efp. The effective potential heights for electrons and holes are marked.
    Fig. 3. Energy band diagrams of (a) the Ref. LD and (b) the New LD structures (black lines) at 120 mA. Symbols + and − represent positive and negative polarization charges. The red lines mark the quasi-Fermi levels Efn and Efp. The effective potential heights for electrons and holes are marked.
    Vertical electron current density distribution along growth direction surrounding the active region for Ref. (black) and New (red) LDs at 120 mA.
    Fig. 4. Vertical electron current density distribution along growth direction surrounding the active region for Ref. (black) and New (red) LDs at 120 mA.
    (a) Electron and (b) hole concentration distribution around the active region for Ref. LD (black) and New LD (red) at 120 mA.
    Fig. 5. (a) Electron and (b) hole concentration distribution around the active region for Ref. LD (black) and New LD (red) at 120 mA.
    Percentage of electron leakage current (black) and RHS hole density of the EBL (red) with varying indium composition of InxGa1−xN at 120 mA except where the point at zero composition of indium is marked as Ref. LD without an InGaN interlayer for comparison.
    Fig. 6. Percentage of electron leakage current (black) and RHS hole density of the EBL (red) with varying indium composition of InxGa1xN at 120 mA except where the point at zero composition of indium is marked as Ref. LD without an InGaN interlayer for comparison.
    Slope efficiency (black) and threshold current (red) of the device versus indium composition of interlayer; the middle inset describes the relationship between the output power and indium composition at 120 mA.
    Fig. 7. Slope efficiency (black) and threshold current (red) of the device versus indium composition of interlayer; the middle inset describes the relationship between the output power and indium composition at 120 mA.
    Xiang Li, Degang Zhao. Effectiveness of inserting an InGaN interlayer to improve the performances of InGaN-based blue-violet laser diodes[J]. Chinese Optics Letters, 2016, 14(6): 062502
    Download Citation