
Zhan Li, Shuaishuai Yang, Qi Xiao, Tianyu Zhang, Yong Li, Lu Han, Dean Liu, Xiaoping Ouyang, Jianqiang Zhu, "Deep reinforcement with spectrum series learning control for a mode-locked fiber laser," Photonics Res. 10, 1491 (2022)
- Photonics Research
- Vol. 10, Issue 6, 1491 (2022)
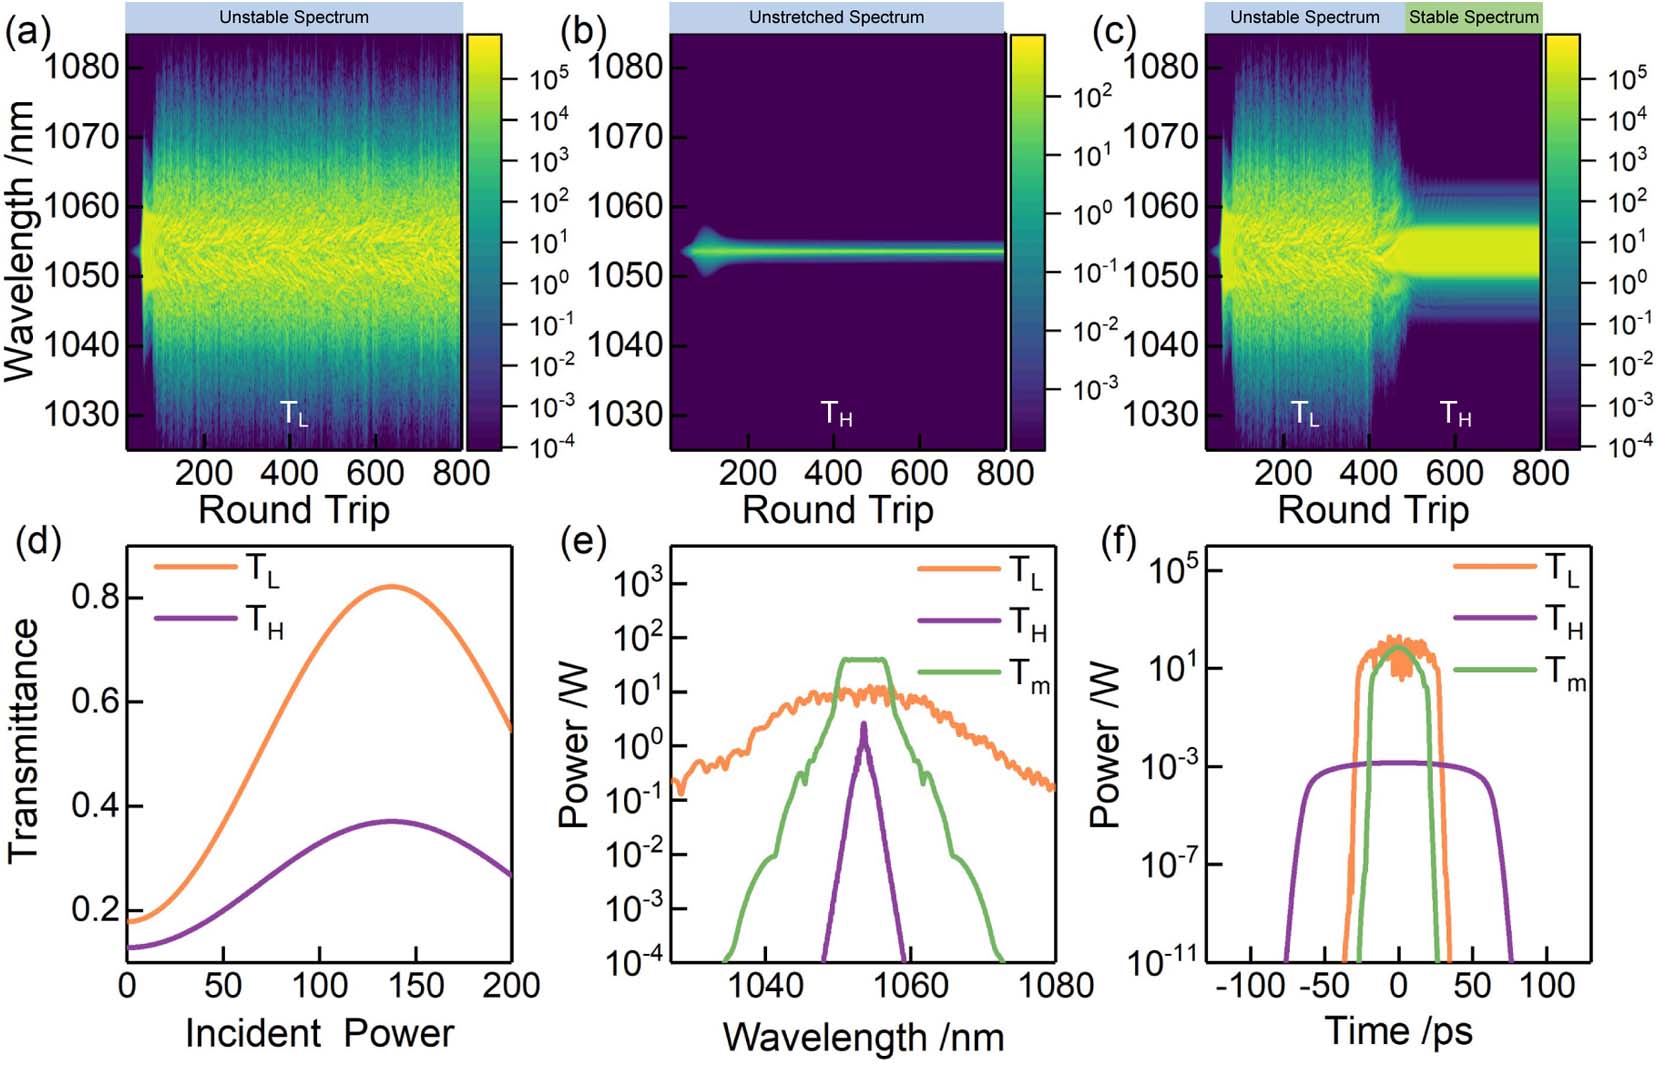
Fig. 1. GNLSE simulation result from the NPE-based mode-locking laser system. (a) Spectral evolution when EPC is in T L T H T L T H T L T H T L T H T m T L T H T m
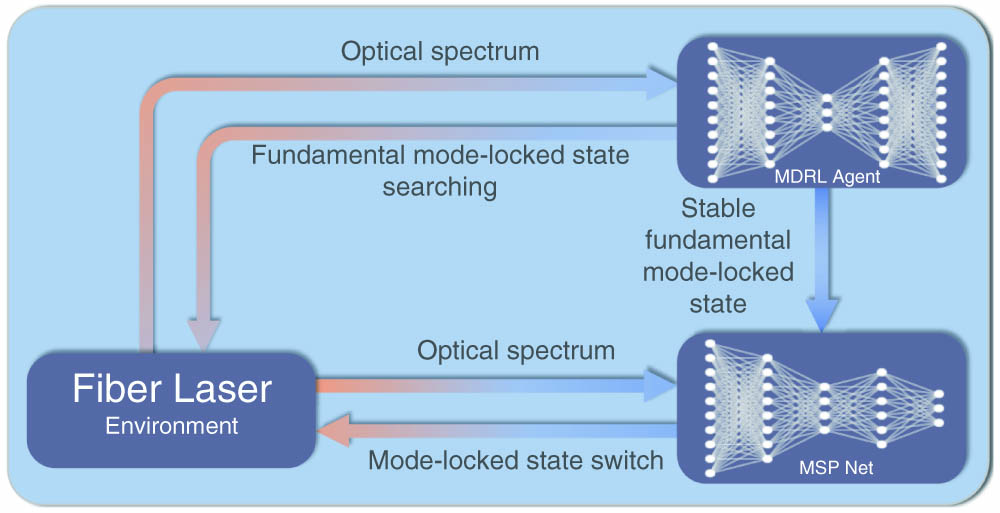
Fig. 2. Feedback time-series spectrum control model.
Fig. 3. MDRL agent layout.
Fig. 4. MDRL environment layout. LD, laser diode; WDM, 980/1060 nm wavelength division multiplexer; YDF, ytterbium-doped fiber; C, coupler; SMF, single-mode fiber; P, polarizer; I, isolator; EPC, electrical polarization controller; SF, optical spectrum filter; D, diagnostic optical spectrum analyzer.
Fig. 5. Spectrum and time-wave evolution during MDRL search. (a) Spectrum evolution data from the spectrum analyzer. (b) Time-wave evolution data from the high-speed photodetector and oscilloscope. (c) Obtained reward at each search step. (d) Direct autocorrelation output (blue line) and autocorrelation output after dispersion compensation (orange square, purple line).
Fig. 6. Mode-locked state switch by MSP. (a) Mode-locked state switch by minimizing the difference between P MSP ( W t ) P MSP ( W c ) L MSP ( W c )
Fig. 7. Algorithm performance. (a) Total search step from 100 random initial states to the mode-locked state using MDRL (purple solid circle), DDPG (orange solid square), and genetic algorithm (green solid triangle). (b) Search stability test at different temperatures with MDRL (purple), DDPG (orange), and genetic algorithm (green).
Fig. 8. Search stability test at different temperatures with MDRL (purple), DDPG (orange), and genetic algorithm (green).
|
Table 1. Time Consumption Comparison with Recent Works


Set citation alerts for the article
Please enter your email address

© Copyright 2018-2021 | Chinese Laser Press. All Rights Reserved 沪ICP备15018463号-20