• Photonics Research
  • Vol. 8, Issue 9, 1468 (2020)
Mu Yang1、2, Qiang Li1、2, Zheng-Hao Liu1、2, Ze-Yan Hao1、2, Chang-Liang Ren3、4、*, Jin-Shi Xu1、2、5、*, Chuan-Feng Li1、2、6、*, and Guang-Can Guo1、2
Author Affiliations
  • 1CAS Key Laboratory of Quantum Information, University of Science and Technology of China, Hefei 230026, China
  • 2CAS Center for Excellence in Quantum Information and Quantum Physics, University of Science and Technology of China, Hefei 230026, China
  • 3Center for Nanofabrication and System Integration, Chongqing Institute of Green and Intelligent Technology, Chinese Academy of Sciences, Chongqing 400714, China
  • 4e-mail: renchangliang@cigit.ac.cn
  • 5e-mail: jsxu@ustc.edu.cn
  • 6e-mail: cfli@ustc.edu.cn
  • show less
    DOI: 10.1364/PRJ.393480 Cite this Article Set citation alerts
    Mu Yang, Qiang Li, Zheng-Hao Liu, Ze-Yan Hao, Chang-Liang Ren, Jin-Shi Xu, Chuan-Feng Li, Guang-Can Guo. Experimental observation of an anomalous weak value without post-selection[J]. Photonics Research, 2020, 8(9): 1468 Copy Citation Text show less
    Theoretical protocol. The system initially in the state |ψ(0)⟩ is sequentially weak coupled with two pointers in the initial states of |ϕ1(0)⟩ and |ϕ2(0)⟩, respectively. The time sequence is denoted as t1, t2, and t3. The pointers are measured individually or jointly.
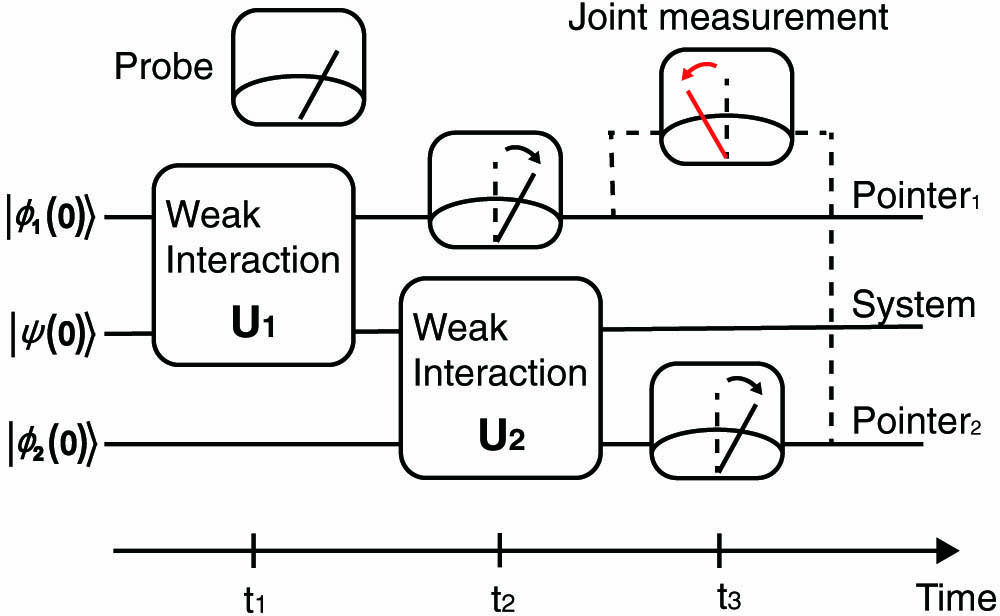
    Fig. 1. Theoretical protocol. The system initially in the state |ψ(0) is sequentially weak coupled with two pointers in the initial states of |ϕ1(0) and |ϕ2(0), respectively. The time sequence is denoted as t1, t2, and t3. The pointers are measured individually or jointly.
    Experimental setup and deflection images. (a) Single photons from a single photon emitter (SPE) are sent to the sequential weak measurement setup. The single photon property is characterized by the second order autocorrelation function, in which the dip at the zero delay time is fitted to be g2(0)=0.025. The polarization of the single photons is set by a half-wave plate (HWP1). A lens (f=150 mm) is used to focus the photon to the right screen of the spatial light modulator (SLM) for the horizontal weak coupling, where the hologram loaded is a vertical grating. The coupling strength is adjusted by changing the density of the grating. The photons are then refocused on the left screen of the SLM by a lens with f=75 mm for the vertical coupling, where the hologram loaded is a horizontal grating with the same density. The HWP2 is used to rotate the polarization of the photon before the screen to adjust the direction of the pointer. The photons are then finally detected by an intensified charge coupled device (ICCD) in the focus plane of a lens with f=150 mm. (b) The images of photon distributions detected by the ICCD with different coupling strengths γexp. The inserts with blue background are the theoretical predictions of the corresponding experimental images when γexp>0.2366, and the Corr represents the correlation value between experimental and theoretical images.
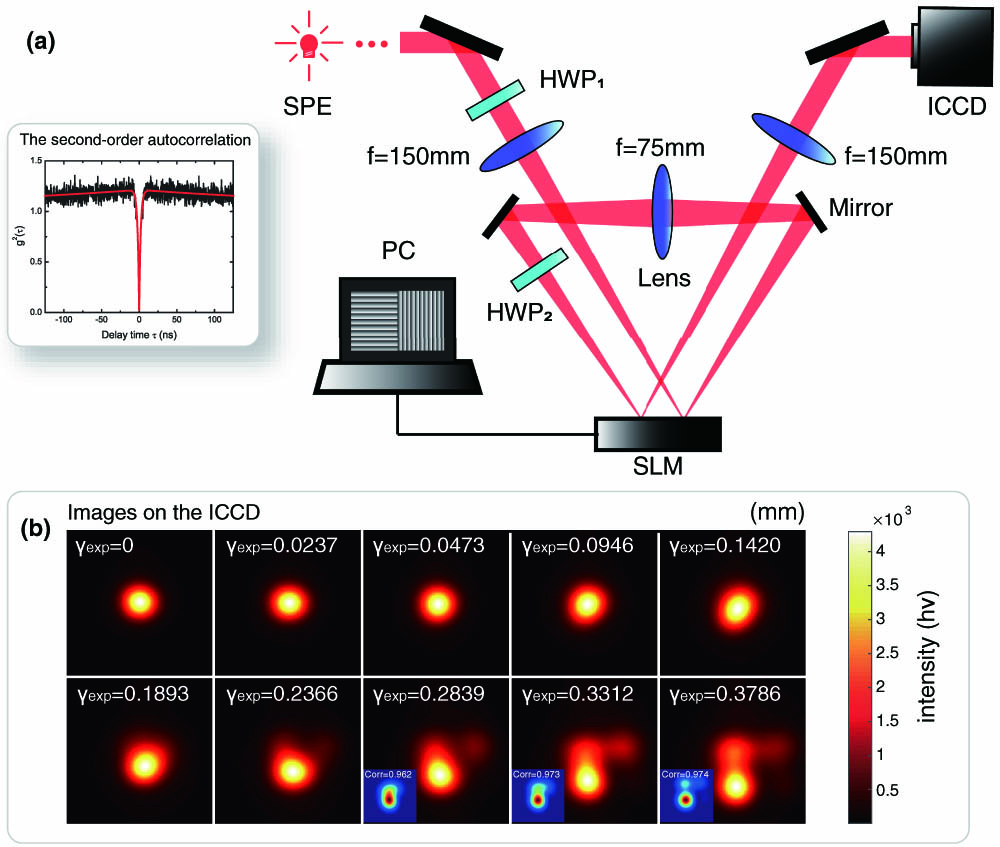
    Fig. 2. Experimental setup and deflection images. (a) Single photons from a single photon emitter (SPE) are sent to the sequential weak measurement setup. The single photon property is characterized by the second order autocorrelation function, in which the dip at the zero delay time is fitted to be g2(0)=0.025. The polarization of the single photons is set by a half-wave plate (HWP1). A lens (f=150  mm) is used to focus the photon to the right screen of the spatial light modulator (SLM) for the horizontal weak coupling, where the hologram loaded is a vertical grating. The coupling strength is adjusted by changing the density of the grating. The photons are then refocused on the left screen of the SLM by a lens with f=75  mm for the vertical coupling, where the hologram loaded is a horizontal grating with the same density. The HWP2 is used to rotate the polarization of the photon before the screen to adjust the direction of the pointer. The photons are then finally detected by an intensified charge coupled device (ICCD) in the focus plane of a lens with f=150  mm. (b) The images of photon distributions detected by the ICCD with different coupling strengths γexp. The inserts with blue background are the theoretical predictions of the corresponding experimental images when γexp>0.2366, and the Corr represents the correlation value between experimental and theoretical images.
    Deflections of the pointer’s position and the normalized result of sequential weak measurements in the one-qubit system. (a) The brown and blue dots represent the experimental results of the pointer positions ⟨x^⟩ and ⟨y^⟩, respectively. The brown and blue lines represent the corresponding theoretical predictions. (b) The green dots represent the experimental results of the joint pointer position ⟨x^⊗y^⟩ with the green solid line representing the corresponding theoretical prediction. The red data represents the anomalous joint pointer position. (c) The black dots represent the inferred values of M=⟨x^⊗y^⟩/γexp2, while the theoretical prediction is shown as a black line.
    Fig. 3. Deflections of the pointer’s position and the normalized result of sequential weak measurements in the one-qubit system. (a) The brown and blue dots represent the experimental results of the pointer positions x^ and y^, respectively. The brown and blue lines represent the corresponding theoretical predictions. (b) The green dots represent the experimental results of the joint pointer position x^y^ with the green solid line representing the corresponding theoretical prediction. The red data represents the anomalous joint pointer position. (c) The black dots represent the inferred values of M=x^y^/γexp2, while the theoretical prediction is shown as a black line.
    Deflections of pointer positions via sequential weak measurements in the two-qubit system. (a) The brown and blue dots represent the experimental results with the brown and blue lines representing the corresponding theoretical predictions, respectively. (b) The green dots represent the joint average pointer positions ⟨x^⊗y^⟩ with the green line representing the corresponding theoretical prediction.
    Fig. 4. Deflections of pointer positions via sequential weak measurements in the two-qubit system. (a) The brown and blue dots represent the experimental results with the brown and blue lines representing the corresponding theoretical predictions, respectively. (b) The green dots represent the joint average pointer positions x^y^ with the green line representing the corresponding theoretical prediction.
    Weak measurement based on the liquid crystal spatial light modulator (SLM). (a) The input photons are transformed from the coordinate space to the momentum space by a Fourier lens and focused on the screen of SLM. A phase that changes linearly along the x direction is applied on photons by the SLM, and then photons are re-transformed from the momentum space to the coordinate space by another Fourier lens. The photon wave packet will be transversely shifted slightly, which is known as weak measurement. (b) The relation between grating densities α on SLM and coupling strength γexp.
    Fig. 5. Weak measurement based on the liquid crystal spatial light modulator (SLM). (a) The input photons are transformed from the coordinate space to the momentum space by a Fourier lens and focused on the screen of SLM. A phase that changes linearly along the x direction is applied on photons by the SLM, and then photons are re-transformed from the momentum space to the coordinate space by another Fourier lens. The photon wave packet will be transversely shifted slightly, which is known as weak measurement. (b) The relation between grating densities α on SLM and coupling strength γexp.
    Experimental setup of the single photon emitter (SPE).
    Fig. 6. Experimental setup of the single photon emitter (SPE).
    Mu Yang, Qiang Li, Zheng-Hao Liu, Ze-Yan Hao, Chang-Liang Ren, Jin-Shi Xu, Chuan-Feng Li, Guang-Can Guo. Experimental observation of an anomalous weak value without post-selection[J]. Photonics Research, 2020, 8(9): 1468
    Download Citation