• Photonics Research
  • Vol. 10, Issue 4, 965 (2022)
Xianfeng Wu, Zhenchun Li, Yuan Zhao, Chaoshun Yang, Wei Zhao, and Xiaopeng Zhao*
Author Affiliations
  • Smart Materials Laboratory, Department of Applied Physics, Northwestern Polytechnical University, Xi’an 710129, China
  • show less
    DOI: 10.1364/PRJ.447131 Cite this Article Set citation alerts
    Xianfeng Wu, Zhenchun Li, Yuan Zhao, Chaoshun Yang, Wei Zhao, Xiaopeng Zhao. Abnormal optical response of PAMAM dendrimer-based silver nanocomposite metamaterials[J]. Photonics Research, 2022, 10(4): 965 Copy Citation Text show less
    Preparation and characterization of PAMAM-Ag. (a) Schematic of the preparation process of PAMAM-Ag. First, PAMAM and AgNO3 reacted in the dark condition to obtain Ag+ complexed with “N” atom of PAMAM, and then were transferred to UV cold light lamp for photochemical reduction. The blue dots represent Ag nanoparticles. (b) H1 NMR analysis of self-prepared 1G–5G PAMAM. (c) HAADF-STEM image of 5G PAMAM-Ag sample: Ag nanoparticles are spherical and distributed in a multilevel netlike sphere. (d) HRTEM image of the Ag nanoparticle: the particle size of Ag is about 9.05 nm, and lattice spacing is 1.56 Å corresponding to the (1 0 5) plane of the Ag hexagonal crystal. (e) Selected area electron diffraction (SAED) spectra of the sample: the calibration image indicates that the diffraction ring in the electron diffraction spectrum corresponds to the diffraction pattern on planes (1 –1 2), (0 0 6), (1 0 5), (1 1 2), and (2 0 3) of the Ag hexagonal crystal. (f) Optical macroscopic (left) and SEM (right) images of 5G PAMAM-Ag film sample. (g) Transmission spectra of 1G–5G PAMAM-Ag film samples in the wavelength range of 300–2400 nm measured by UV-Vis-NIR spectrophotometer (U-4100, HITACHI). The yellow dotted line is the measurement of pure PAMAM.
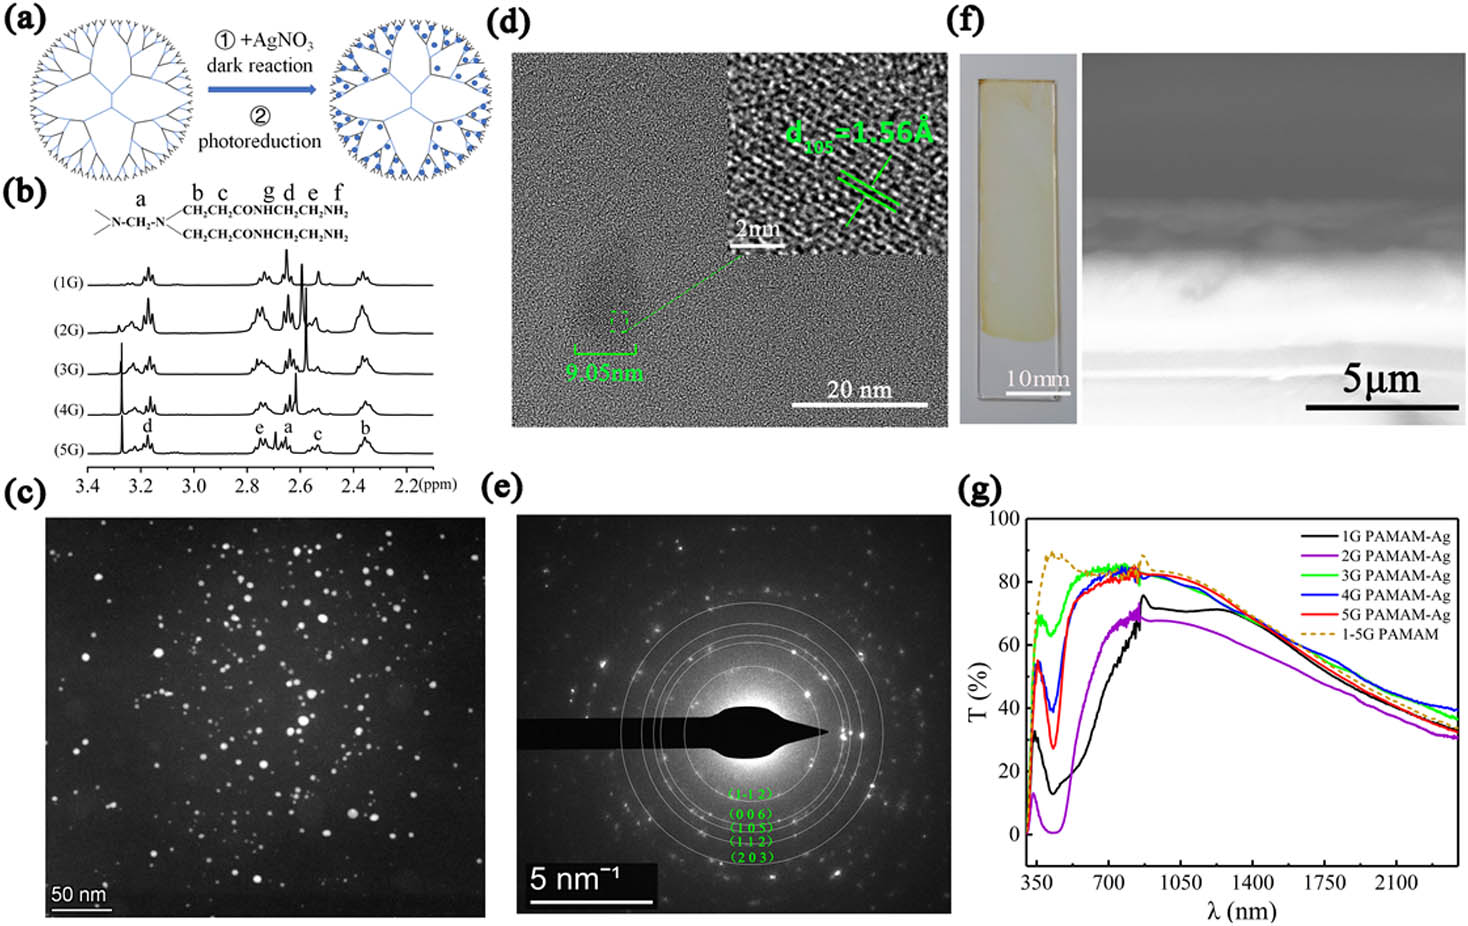
    Fig. 1. Preparation and characterization of PAMAM-Ag. (a) Schematic of the preparation process of PAMAM-Ag. First, PAMAM and AgNO3 reacted in the dark condition to obtain Ag+ complexed with “N” atom of PAMAM, and then were transferred to UV cold light lamp for photochemical reduction. The blue dots represent Ag nanoparticles. (b) H1 NMR analysis of self-prepared 1G–5G PAMAM. (c) HAADF-STEM image of 5G PAMAM-Ag sample: Ag nanoparticles are spherical and distributed in a multilevel netlike sphere. (d) HRTEM image of the Ag nanoparticle: the particle size of Ag is about 9.05 nm, and lattice spacing is 1.56 Å corresponding to the (1 0 5) plane of the Ag hexagonal crystal. (e) Selected area electron diffraction (SAED) spectra of the sample: the calibration image indicates that the diffraction ring in the electron diffraction spectrum corresponds to the diffraction pattern on planes (1 –1 2), (0 0 6), (1 0 5), (1 1 2), and (2 0 3) of the Ag hexagonal crystal. (f) Optical macroscopic (left) and SEM (right) images of 5G PAMAM-Ag film sample. (g) Transmission spectra of 1G–5G PAMAM-Ag film samples in the wavelength range of 300–2400 nm measured by UV-Vis-NIR spectrophotometer (U-4100, HITACHI). The yellow dotted line is the measurement of pure PAMAM.
    Experimental measurement of the GH shift and SHEL. Schematic of the experimental setup for (a) GH shift and (b) SHEL. P1, polarizer to obtain linearly polarized light; P2, polarization analyzer to obtain interference fringes in directions of 45° and 135°, respectively; Wollaston prism splits light into two beams, namely, s- and p-polarized light; M, plane mirror; BS, beam splitter; λ/4, quarter-wave plate to obtain RCP and LCP beams. The white board receives the interference pattern, and the CCD records the image. The interference fringes from (c) 45° and (d) 135° P2 are recorded, and then horizontally spliced into an image (e) to calculate the phase difference Δφ1. The results in (c)–(e) come from the GH shift measurement of K9 glass at 632.8 nm. Curves of the relationship between incident angle θ and (f) DGH, (g) DSHEL generated by the 5G PAMAM-Ag at different incident wavelengths. The GH shift at 473, 532, 589, and 671 nm, and the shift of SHEL at 532, 589, and 632.8 nm are measured experimentally. The K9 glass is measured for comparison with the sample.
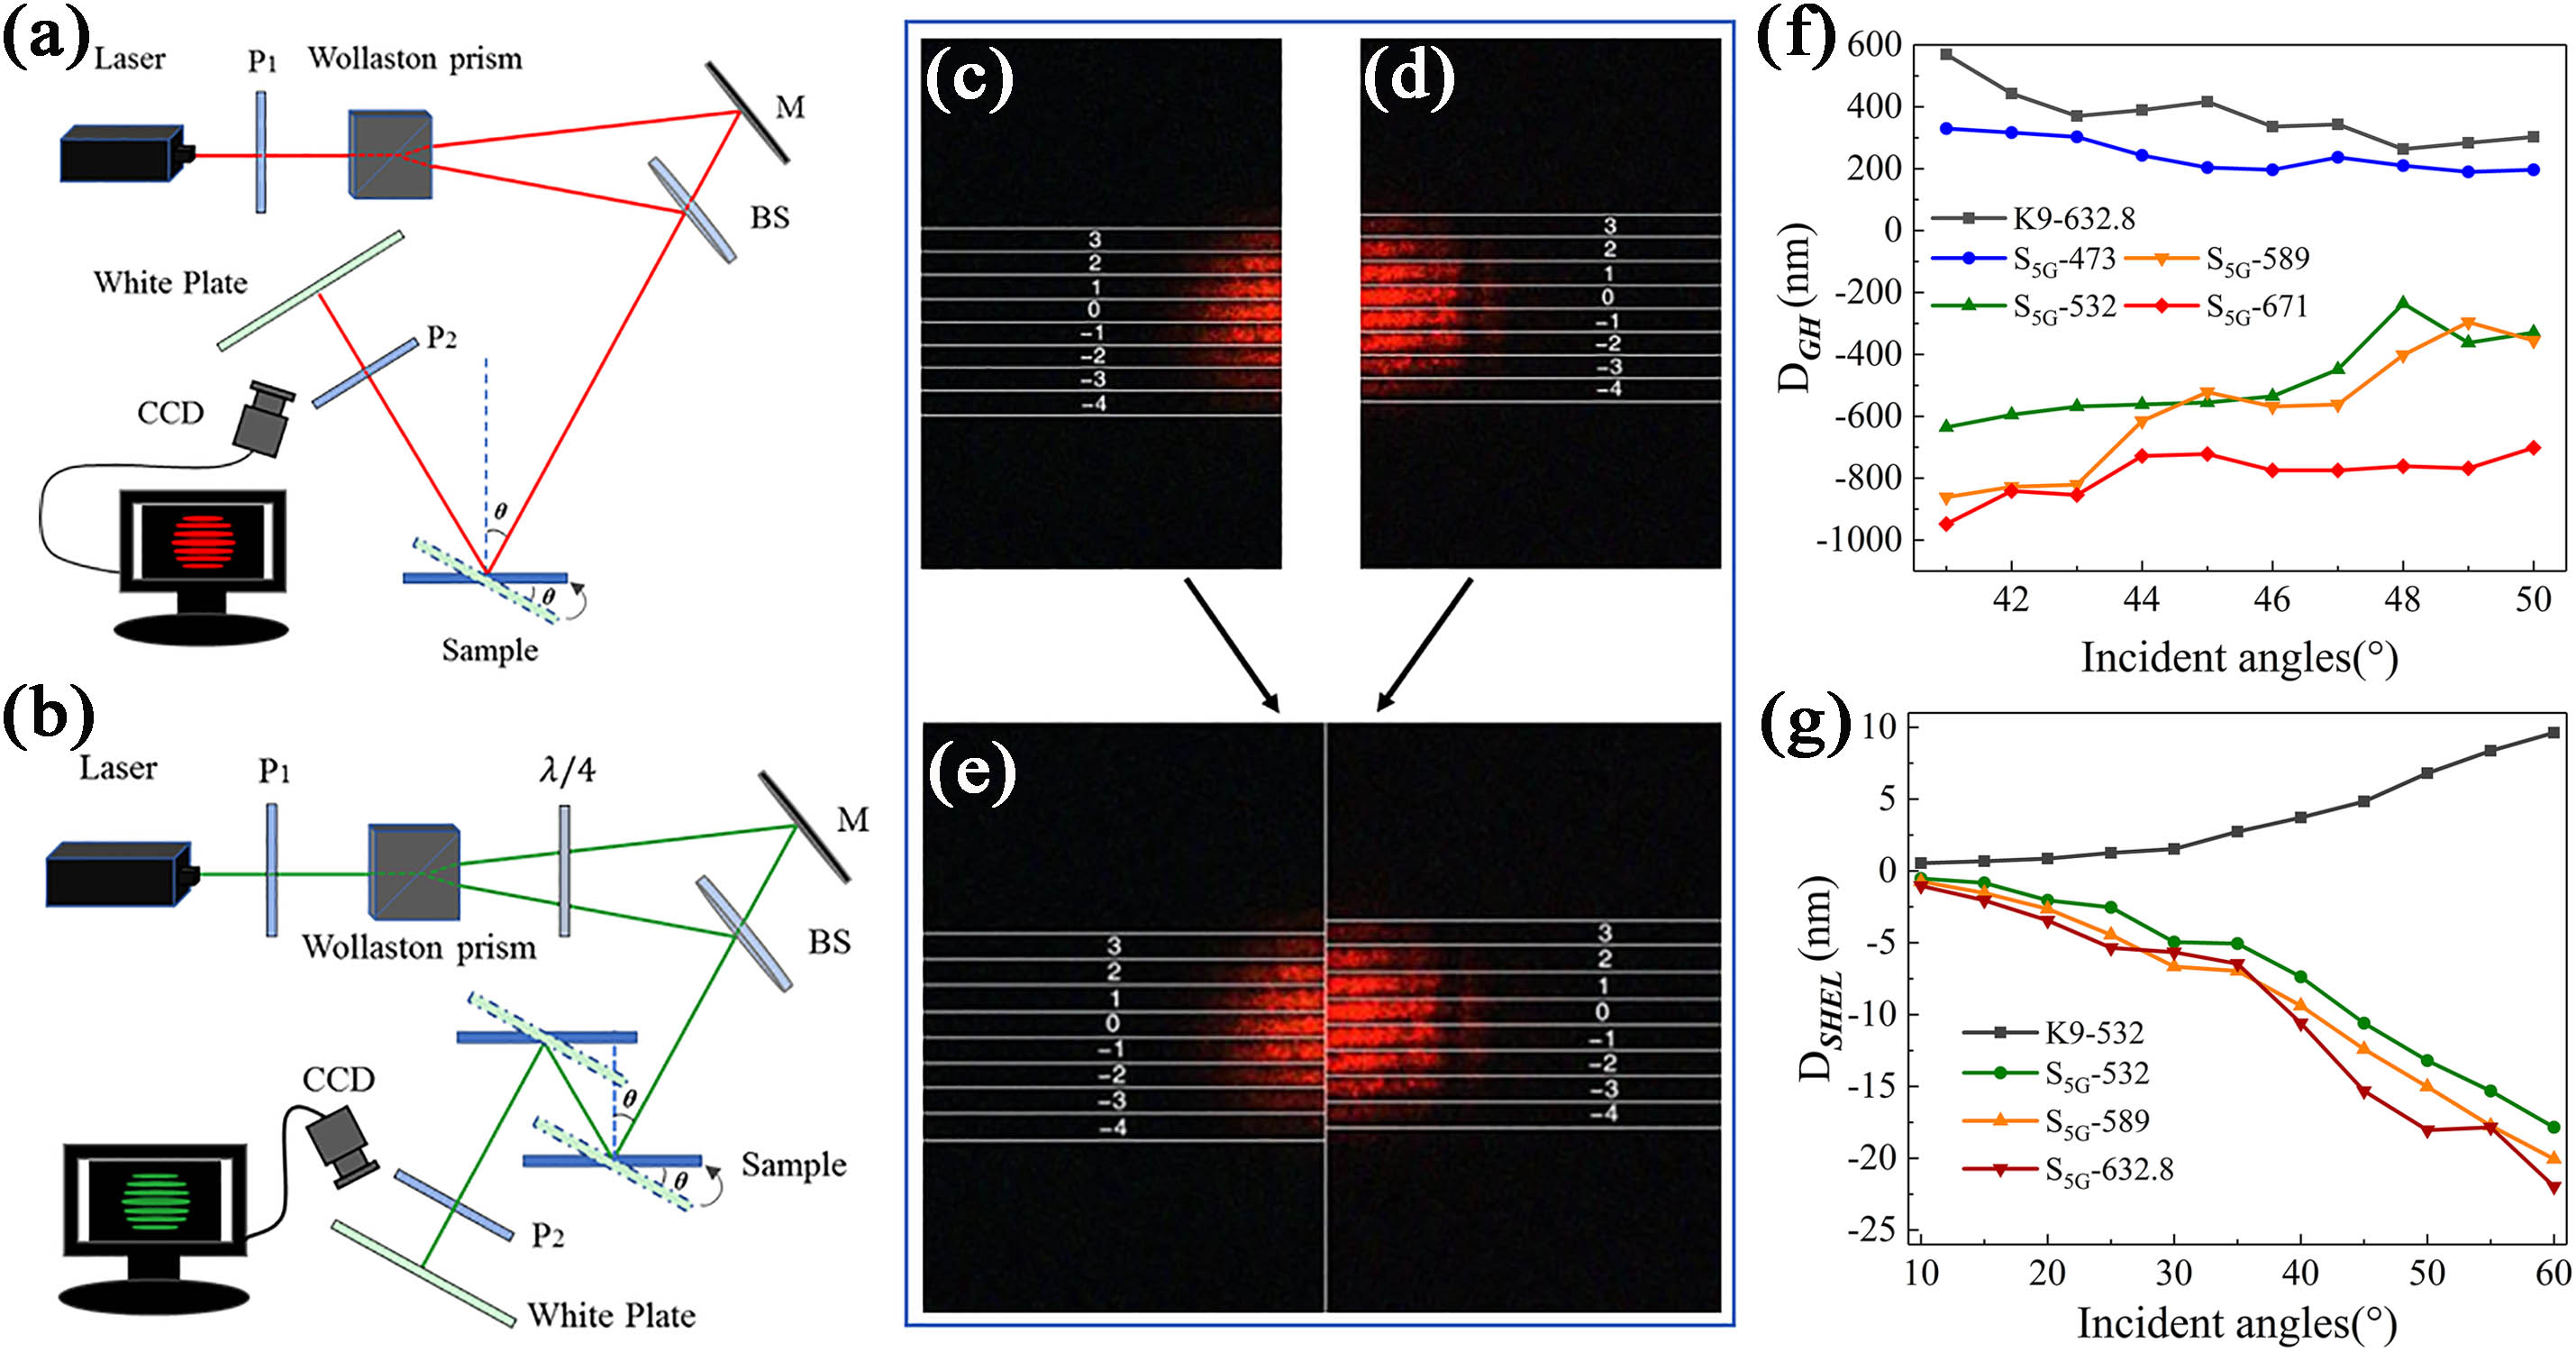
    Fig. 2. Experimental measurement of the GH shift and SHEL. Schematic of the experimental setup for (a) GH shift and (b) SHEL. P1, polarizer to obtain linearly polarized light; P2, polarization analyzer to obtain interference fringes in directions of 45° and 135°, respectively; Wollaston prism splits light into two beams, namely, s- and p-polarized light; M, plane mirror; BS, beam splitter; λ/4, quarter-wave plate to obtain RCP and LCP beams. The white board receives the interference pattern, and the CCD records the image. The interference fringes from (c) 45° and (d) 135° P2 are recorded, and then horizontally spliced into an image (e) to calculate the phase difference Δφ1. The results in (c)–(e) come from the GH shift measurement of K9 glass at 632.8 nm. Curves of the relationship between incident angle θ and (f) DGH, (g) DSHEL generated by the 5G PAMAM-Ag at different incident wavelengths. The GH shift at 473, 532, 589, and 671 nm, and the shift of SHEL at 532, 589, and 632.8 nm are measured experimentally. The K9 glass is measured for comparison with the sample.
    Slab focusing effect of PAMAM-Ag. (a) Schematic of the experimental setup for flat lens focusing. Inset scenario 1 corresponds to the scene where the flat lens works; scenario 2 occurs when the beams diverge. Light source, LHX150 tungsten light source and monochromator; ND, neutral density filter; FP, fiber probe; FOS, fiber optical spectrometer. (b) Lower panel: measured field amplitude of focused beam generated by 5G PAMAM-Ag film sample at 1050 nm wavelength with the acceptor moving along the x direction. Color bar: normalized intensity. Upper panel: measured intensity distribution along x direction at the image plane (y=0 mm, marked area). (c) Slab focusing experiment of 5G PAMAM-Ag film sample in visible–near infrared wave band. The 5G PAMAM-Ag film sample has a different degree of focusing effect at 450–1500 nm. The corresponding focusing distance and percentage increment of light intensity after focusing relative to that prior to focusing are shown in (d). (e), (f) Experimental results of 4G PAMAM-Ag thin film sample under the same conditions. (g) Experimental results of pure PAMAM film sample.
    Fig. 3. Slab focusing effect of PAMAM-Ag. (a) Schematic of the experimental setup for flat lens focusing. Inset scenario 1 corresponds to the scene where the flat lens works; scenario 2 occurs when the beams diverge. Light source, LHX150 tungsten light source and monochromator; ND, neutral density filter; FP, fiber probe; FOS, fiber optical spectrometer. (b) Lower panel: measured field amplitude of focused beam generated by 5G PAMAM-Ag film sample at 1050 nm wavelength with the acceptor moving along the x direction. Color bar: normalized intensity. Upper panel: measured intensity distribution along x direction at the image plane (y=0  mm, marked area). (c) Slab focusing experiment of 5G PAMAM-Ag film sample in visible–near infrared wave band. The 5G PAMAM-Ag film sample has a different degree of focusing effect at 450–1500 nm. The corresponding focusing distance and percentage increment of light intensity after focusing relative to that prior to focusing are shown in (d). (e), (f) Experimental results of 4G PAMAM-Ag thin film sample under the same conditions. (g) Experimental results of pure PAMAM film sample.
    Schematic and band structures of the 2D valley–Hall PTI. (a) 3D schematic and top view of the 2D valley–Hall PTI composed of dendritic structure with four-level branch in hexagonal lattice arrangement. Geometric parameters are a=350 nm, D=18 nm, l1=25 nm, l2=50 nm, l3=85 nm, and l4=125 nm. Angles of l1, l2, l3, and l4 with respect to the horizontal dotted line are 0°, 15°, 30°, and 42°, respectively. The distance between adjacent Ag nanoparticles on the same arc is the same. (b) Band structure of the 2D dendritic structure in (a). The inset shows the first Brillouin zone of the 2D hexagonal lattice. The band structures in (c) and (d) are obtained by rotating the 2D dendritic structures in (a) at φ=−30° and 30° (counterclockwise direction is positive), respectively. K+ and K− represent the corresponding valley states, and the light blue region indicates a complete bandgap. (e), (f) Band structures of three-level branch units at φ=−30° and 30°, respectively.
    Fig. 4. Schematic and band structures of the 2D valley–Hall PTI. (a) 3D schematic and top view of the 2D valley–Hall PTI composed of dendritic structure with four-level branch in hexagonal lattice arrangement. Geometric parameters are a=350  nm, D=18  nm, l1=25  nm, l2=50  nm, l3=85  nm, and l4=125  nm. Angles of l1, l2, l3, and l4 with respect to the horizontal dotted line are 0°, 15°, 30°, and 42°, respectively. The distance between adjacent Ag nanoparticles on the same arc is the same. (b) Band structure of the 2D dendritic structure in (a). The inset shows the first Brillouin zone of the 2D hexagonal lattice. The band structures in (c) and (d) are obtained by rotating the 2D dendritic structures in (a) at φ=30° and 30° (counterclockwise direction is positive), respectively. K+ and K represent the corresponding valley states, and the light blue region indicates a complete bandgap. (e), (f) Band structures of three-level branch units at φ=30° and 30°, respectively.
    Xianfeng Wu, Zhenchun Li, Yuan Zhao, Chaoshun Yang, Wei Zhao, Xiaopeng Zhao. Abnormal optical response of PAMAM dendrimer-based silver nanocomposite metamaterials[J]. Photonics Research, 2022, 10(4): 965
    Download Citation