• Photonics Research
  • Vol. 10, Issue 4, 965 (2022)
Xianfeng Wu, Zhenchun Li, Yuan Zhao, Chaoshun Yang, Wei Zhao, and Xiaopeng Zhao*
Author Affiliations
  • Smart Materials Laboratory, Department of Applied Physics, Northwestern Polytechnical University, Xi’an 710129, China
  • show less
    DOI: 10.1364/PRJ.447131 Cite this Article Set citation alerts
    Xianfeng Wu, Zhenchun Li, Yuan Zhao, Chaoshun Yang, Wei Zhao, Xiaopeng Zhao. Abnormal optical response of PAMAM dendrimer-based silver nanocomposite metamaterials[J]. Photonics Research, 2022, 10(4): 965 Copy Citation Text show less

    Abstract

    Optical metamaterials present opportunities and challenges for manipulation of light. However, metamaterials with visible and near infrared responses are still particularly challenging to fabricate due to the complex preparation process and high loss. Here, a visible light poly(amidoamine) (PAMAM)-Ag metamaterial is prepared with the assistance of fifth-generation PAMAM (5G PAMAM), based on the dendritic structure. The large area of metamaterials, where Ag nanoparticles are spherical with diameters of 9 nm and distributed in a multilevel netlike sphere, results in broadband resonance. The negative Goos–Hänchen shift and anomalous spin Hall effect of light generated by 5G PAMAM-Ag in visible broadband are observed, and a strong slab focusing effect at 750–1050 nm is demonstrated. In addition, the simulation shows possible application of the dendritic structure in topological photonics. The results offer advances in the preparation of large-scale visible light metamaterials, showing the potential for subwavelength super-resolution imaging and quantum optical information fields.

    1. INTRODUCTION

    Optical metamaterials as types of emerging materials can alter the temporal and spatial propagation of electromagnetic fields at the nanoscale, resulting in negative refraction [15], negative Goos–Hänchen (GH) shift [6,7], anomalous spin Hall effect of light (SHEL) [8,9], super-resolution imaging [1012], invisibility cloak [13], photoluminescence [14], and other magical functions. The anomalous manipulation of light in metamaterials may bring more attractive and potential applications; the negative GH shift has been proven to achieve slowing down of light [7,15]. However, experimental observation of anomalous SHEL is a real challenge because the spin–orbit interaction is generally weak [16], and its magnitude is exceedingly small. What is more, the development of optical negative index metamaterials has encountered a bottleneck, suffering from extreme propagation losses [17].

    In 2015, High et al. [8] proposed a hyperbolic metasurface composed of single-crystal silver nanostructures that can generate anomalous SHEL in the hyperbolic regime (λ<580  nm). Recently, Chen et al. [9] observed anomalous SHEL at 632.8 nm using metasurfaces assembled by quasiperiodic dendritic cluster sets. Other than these, metamaterials that can generate anomalous SHEL are rarely reported. Many current methods to fabricate optical metamaterials are still lithographic-based approaches. Very few large-scale optical metamaterials can be applied; although metasurfaces [18] overcome the shortcomings of 3D metamaterials to some extent, metamaterials with an optical response at visible and near-infrared frequencies are still particularly challenging to fabricate due to the expensive, time-consuming, and complex preparation process. This problem restricts the application of optical metamaterials and makes the study of anomalous SHEL still a tricky problem.

    At present, the bottom-up method can realize the preparation of metamaterials without lithography [19]; it has achieved certain results, but the difficulty lies in accurate control of the size and position of the material structure. Superlattices consisting of noble-metal nanoparticles have emerged as a new platform for bottom-up designed metamaterials [20,21] and are expected to generate new negative index materials at visible frequencies. Noble metals are known to interact very efficiently with visible light due to so-called localized surface plasmon resonance (LSPR) excitation; they are highly sensitive to the size, shape, and environment of nanostructures [22]. On this basis, many effective dielectrics have emerged in visible and infrared wave bands using nanoscale metallic particle arrays, but the highly dispersive and lossy metallic response is also troubling [23]. Assembling metallic nanoparticles into macroscopic structures with well-defined order and symmetry is key to achieving material properties [24]. Recently, we found that the unique 3D symmetrical spherical structure of high-generation dendritic macromolecules [25,26] is a powerful tool to assist in the manufacture of metamaterials with uniform size and orderly distribution of metal nanoparticles. Dendritic macromolecules have excellent fractal characteristics. These unique molecular structures and chemical properties are studied in depth and applied in the fields of catalytic reactions [27], biomedicine [28], molecular functionalization [29], preparation of nanomaterials [30], and material modification [31]. Although dendrimers offer remarkable convenience in the field of material preparation, they have never been mentioned for the preparation of metamaterials. Coincidentally, the metal dendritic model [7,9,32,33] has been proven to be a type of metamaterial with multilevel split-ring and equivalent wires. Nanocomposite metamaterials can be obtained using dendrimers to control the particle size and distribution of metal nanoparticles because dendrimers have multilevel-ordered structures similar to the metal dendritic model. This condition is different from highly lossy metallic metamaterials with tightly packed plasma at visible light frequencies [34]; it is highly transparent due to its small particle size and fractal arrangement.

    Here, we experimentally demonstrate poly(amidoamine) (PAMAM) dendrimer-based silver nanocomposite metamaterials with abnormal optical response. Using PAMAM as a template and stabilizers, the photochemically reduced Ag can attach to the molecular cavity and grow. Metamaterials PAMAM-Ag prepared by high-generation PAMAM obtain controllable and well-stabilized Ag nanoparticles that are distributed in a multilevel netlike sphere, thereby resulting in anomalous optical manipulation. Experiments show that fifth-generation (5G) PAMAM-Ag can generate a negative GH shift and an anomalous SHEL in visible light broadband (covering the main bands from green light to red light) over a wide range of incident angles; the 5G PAMAM-Ag flat lens [35] shows efficient focusing effect at 750–1050 nm. Finally, a 2D visible light valley–Hall photonic topological insulator (PTI) is simulated based on the dendritic structure of PAMAM-Ag, which may bring more potential applications in topology transmission. The PAMAM-assisted bottom-up preparation method of metamaterials is simple and convenient and provides a new means for developing optical metamaterials.

    2. RESULTS AND DISCUSSION

    A. Preparation and Characterization

    The preparation methods of PAMAM [25,26] have been complete. PAMAM is synthesized through repeated iterative growth; each of its repeated branched layers is called a “generation,” and the synthesis methods include divergent synthesis, convergent synthesis, and the combination of these methods. Dendritic macromolecules have a large number of cavities that can wrap nanoparticles inside, preventing their aggregation and better controlling size, shape, and dispersion. More importantly, dendrimers do not passivate nanoparticles, preserving their optical properties. As shown in Fig. 1(a), AgNO3 was weighed according to the molar ratio nPAMAM:nAgNO3=1:2, and then mixed with PAMAM [Fig. 1(a) left panel shows the schematic diagram of molecular structure] aqueous solution for the reaction in dark conditions (stirring at room temperature for 24 h) to obtain the Ag+ full coordinate with “N” atoms of dendritic macromolecules. After sufficient coordination, they were transferred to a UV cold light lamp for photochemical reduction [36,37] of Ag [solid blue dots in Fig. 1(a), right panel]. In this work, 1G–5G PAMAM macromolecules were made by a divergent synthesis method for subsequent studies (Appendix A). As shown in Fig. 1(b), 1G–5G PAMAM samples were characterized by H1 nuclear magnetic resonance (NMR) analysis (using D2O as solvent). The high-generation PAMAM molecule has repetitive chain segments on branches, and has the same type of hydrogen atoms in a chemical environment as 1G PAMAM molecules [Fig. 1(b), upper panel]. Hydrogen atoms marked as f and g in the unit structure are active hydrogen and will not appear in H1 NMR spectra when D2O is used as an exchange agent, and the remaining five hydrogen atoms are labeled with a, b, c, d, and e. Five major peaks were found in the H1 NMR spectra, and the chemical shifts (δ) of hydrogen atoms at a, b, c, d, and e in 5G PAMAM were 2.66, 2.36, 2.54, 3.17, and 2.75, respectively [Fig. 1(b), lower panel]. The chemical shifts of hydrogen atoms of 1G–5G PAMAM corresponding to the main peaks are almost the same, which is consistent with theory. The prepared composite metamaterial is referred to as PAMAM-Ag, where Ag grew by attaching to the dendrimer molecular cavity. Photochemical reduction of Ag does not introduce new ions in the reaction process and can control the concentration of synthesized particles; this approach exhibits advantages over other reduction processes. During the reaction, dendrimers act as a “network vessel” for capturing Ag+ and a reagent for electron transfer. Prior to photochemical reduction, Ag+ was fixed by “N” atoms of PAMAM. The reduced Ag spherical nanoparticles of 5G PAMAM had a particle size of 9  nm and were distributed in a multilevel netlike sphere due to the limitation of the PAMAM template [Fig. 1(c)]. The high-resolution transmission electron microscopy (HRTEM) image and selected area electron diffraction (SAED) spectra were analyzed to demonstrate the existence state of Ag. The inset in Fig. 1(d) shows that the lattice spacing is 1.56 Å (1 Å = 0.1 nm), representing the (1 0 5) plane of the Ag hexagonal crystal corresponding to the determination of Ag (PDF#41-1402 standard card). Moreover, the calibrated diffraction ring in the SAED spectra [Fig. 1(e)] corresponds to the diffraction pattern on planes (1 –1 2), (0 0 6), (1 0 5), (1 1 2), and (2 0 3) of the Ag hexagonal crystal.

    Preparation and characterization of PAMAM-Ag. (a) Schematic of the preparation process of PAMAM-Ag. First, PAMAM and AgNO3 reacted in the dark condition to obtain Ag+ complexed with “N” atom of PAMAM, and then were transferred to UV cold light lamp for photochemical reduction. The blue dots represent Ag nanoparticles. (b) H1 NMR analysis of self-prepared 1G–5G PAMAM. (c) HAADF-STEM image of 5G PAMAM-Ag sample: Ag nanoparticles are spherical and distributed in a multilevel netlike sphere. (d) HRTEM image of the Ag nanoparticle: the particle size of Ag is about 9.05 nm, and lattice spacing is 1.56 Å corresponding to the (1 0 5) plane of the Ag hexagonal crystal. (e) Selected area electron diffraction (SAED) spectra of the sample: the calibration image indicates that the diffraction ring in the electron diffraction spectrum corresponds to the diffraction pattern on planes (1 –1 2), (0 0 6), (1 0 5), (1 1 2), and (2 0 3) of the Ag hexagonal crystal. (f) Optical macroscopic (left) and SEM (right) images of 5G PAMAM-Ag film sample. (g) Transmission spectra of 1G–5G PAMAM-Ag film samples in the wavelength range of 300–2400 nm measured by UV-Vis-NIR spectrophotometer (U-4100, HITACHI). The yellow dotted line is the measurement of pure PAMAM.

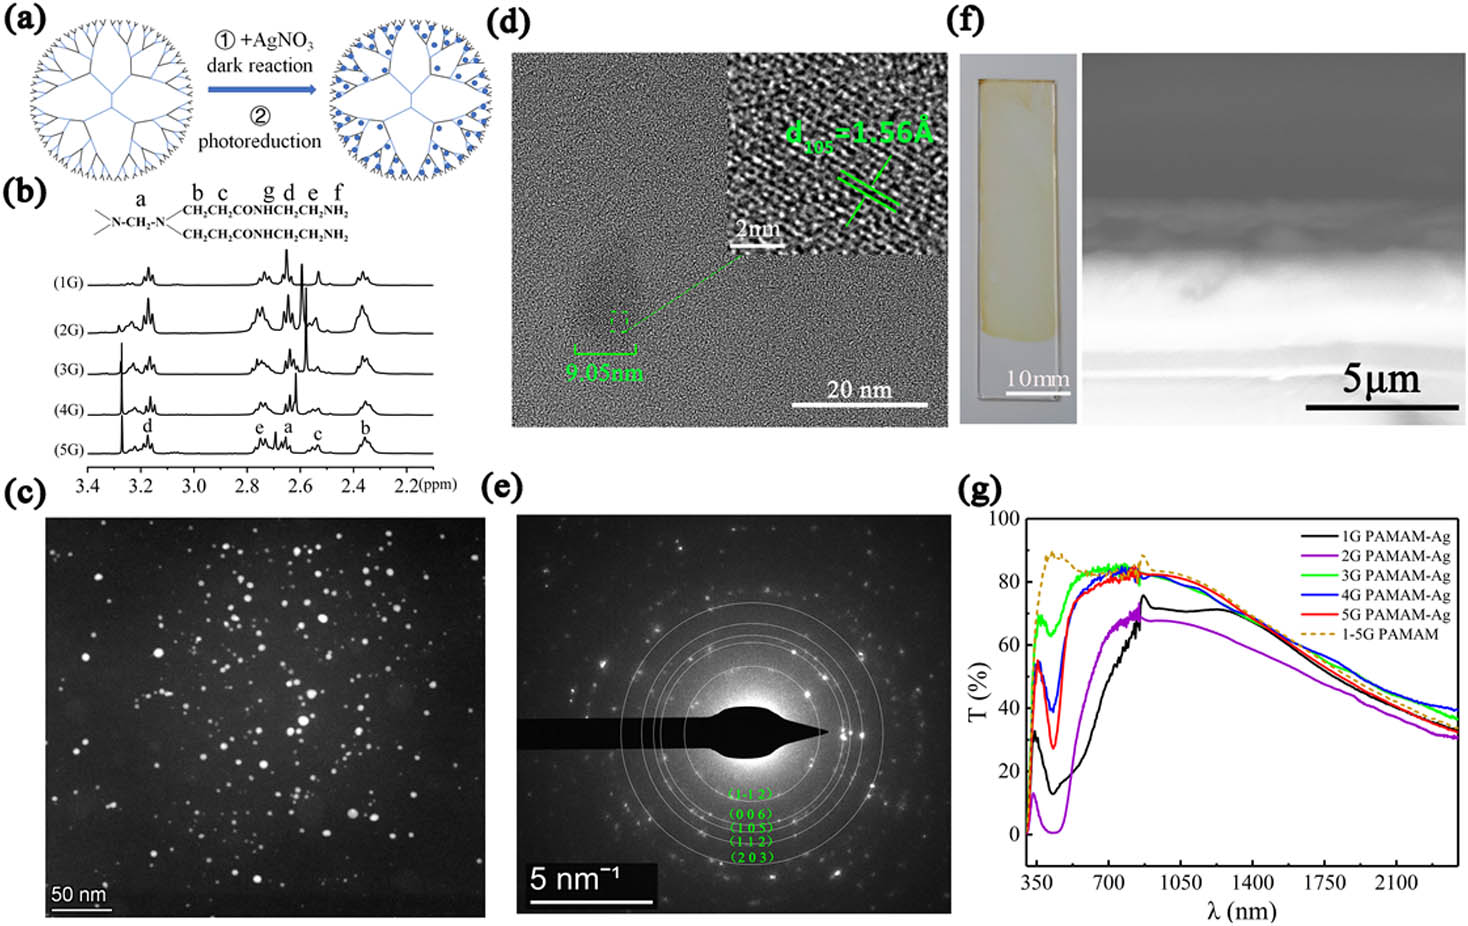
    Figure 1.Preparation and characterization of PAMAM-Ag. (a) Schematic of the preparation process of PAMAM-Ag. First, PAMAM and AgNO3 reacted in the dark condition to obtain Ag+ complexed with “N” atom of PAMAM, and then were transferred to UV cold light lamp for photochemical reduction. The blue dots represent Ag nanoparticles. (b) H1 NMR analysis of self-prepared 1G–5G PAMAM. (c) HAADF-STEM image of 5G PAMAM-Ag sample: Ag nanoparticles are spherical and distributed in a multilevel netlike sphere. (d) HRTEM image of the Ag nanoparticle: the particle size of Ag is about 9.05 nm, and lattice spacing is 1.56 Å corresponding to the (1 0 5) plane of the Ag hexagonal crystal. (e) Selected area electron diffraction (SAED) spectra of the sample: the calibration image indicates that the diffraction ring in the electron diffraction spectrum corresponds to the diffraction pattern on planes (1 –1 2), (0 0 6), (1 0 5), (1 1 2), and (2 0 3) of the Ag hexagonal crystal. (f) Optical macroscopic (left) and SEM (right) images of 5G PAMAM-Ag film sample. (g) Transmission spectra of 1G–5G PAMAM-Ag film samples in the wavelength range of 300–2400 nm measured by UV-Vis-NIR spectrophotometer (U-4100, HITACHI). The yellow dotted line is the measurement of pure PAMAM.

    The film sample is prepared by a spin coating method (1600 r/min for 30 s). The 5G PAMAM-Ag film sample, as an example, has a size of 1.2  cm×4  cm [Fig. 1(f), left panel], and the scanning electron microscopy (SEM) image shows that the thickness of the film is 4  μm [Fig. 1(f), right panel]. We can coat it as a film of almost any shape and size when required. Evidently, the transmission spectra in the visible–near infrared wave band show that PAMAM-Ag is highly transparent, and the transmittance reaches 80%; thus, it is very suitable for optical frequency studies [Fig. 1(g)]. The transmission curve of the pure PAMAM has a transmission peak at 430 nm (which is the inherent transmission peak of PAMAM); the transmission peak of the PAMAM-Ag disappears at 430 nm, and a new transmission peak appears near the wavelength of 400 nm. Generally, the new transmission peak is caused by the resonance of Ag nanoparticles, according to the theory of metal plasma resonance [38]. This finding indirectly proves that Ag+ coordinates with dendritic macromolecules and successfully reduces Ag nanoparticles. In addition to the appearance of the silver intrinsic peak, another resonant peak appeared after the wavelength of 500 nm; it is speculated to be the characteristic resonant wave band of the metamaterial. Generally, the third generation of dendritic macromolecules is the boundary between 3D spherical structure and planar linear structure. A 1G–2G PAMAM molecule presents a linear structure with fewer internal cavities and the weak ability to wrap Ag nanoparticles. Therefore, it cannot serve as an ideal template. The low content and poorly ordered distribution of Ag nanoparticles in 1G–2G PAMAM-Ag result in a low intrinsic transmission peak and characteristic resonant wave band. 3G PAMAM-Ag has a higher intrinsic transmission peak, but its characteristic resonant wave band is still not broad enough. When the “generation” is greater than or equal to four, the chemical structure of PAMAM presents a 3D symmetrical sphere, with more abundant internal cavities. It becomes a template and nano reaction container that is more conducive to the preparation of well-dispersed and stable Ag nanoparticles due to these properties. The size and arrangement of Ag nanoparticles in 4G–5G PAMAM-Ag approach the proposed model, and they can generate characteristic resonance in a wider wave band. In addition, the results show that the resonant wave band of PAMAM-Ag moves to the short wavelength with the increase in “generation.” Thus, we can obtain appropriate operating frequencies. Therefore, the experiments mainly discuss the results of 4G–5G PAMAM-Ag.

    B. Negative GH Shift and Anomalous SHEL at Visible Frequencies

    When a bounded beam is reflected from the interface between two media, it produces small shifts relative to geometric optic prediction. The shift along the interface and in the direction of beam propagation is referred to as GH shift [39], which is described in terms of evanescent wave penetration. Different from GH shift, the SHEL [40] is a result of effective spin–orbit interaction and refers to the transverse splitting in polarizations after reflection or refraction to conserve total angular momentum. These shifts have been used in the field of sensing [41,42]. Furthermore, SHEL can be used to develop spin-dependent devices for precision measurement [43], circular dichroism spectrometric detection [44], and optoelectronic information fields [45]. Some reports focus on enhancing the shift by up to an order of amplification and have made some progress, but they are almost numerical results [46,47]. Current studies have shown that the boundary between the negative index medium and the conventional medium will lead to the reverse anomaly of these shifts, namely, negative GH shift [6,7] and anomalous SHEL [8,9]. Using PAMAM dendrimer-based metamaterials, we experimentally observed clearly identifiable negative GH shift and anomalous SHEL at visible frequencies, covering from the green light wave band to the red light wave band.

    5G PAMAM-Ag film samples are measured using the methods proposed by Prajapati et al. [48,49]. Both measurement methods obtain a tiny shift value by analyzing the movement of the interference fringe. GH shift measurement is achieved by the interference of s-polarized and p-polarized beams, and SHEL measurement is achieved by the interference of right-circularly polarized (RCP) and left-circularly polarized (LCP) beams. Figure 2(a) shows a schematic of the experimental setup for GH shift. S-polarized and p-polarized beams from a Wollaston prism are incident on the sample at an angle of θ and partially reflected from the sample where they experience GH shift. As shown in Figs. 2(c)–2(e), the interference fringes from 45° and 135° P2 are recorded, and then horizontally spliced into an image to calculate the phase difference Δφ1 (an additional phase π generated by P2 should be subtracted); thus, we can calculate DGH. Figure 2(b) shows a schematic of the experimental setup for SHEL, and its principle is similar to that of Fig. 2(a). The difference is that a quarter-wave plate at an angle of 45° with respect to the incident light beam converts the s- and p-polarized light into RCP and LCP beams, respectively. The roles of RCP and LCP beams correspond to the upper and lower components of electron spin. These circularly polarized beams are reflected from the sample and experience SHEL. DGH and DSHEL are given by Eqs. (1) and (2), respectively: DGH=λ2πΔφ1sinθ,DSHEL=λ2πΔφ2cosθ,where θ is the incident angle, λ is the wavelength of incident light, and Δφ1 and Δφ2 are phase changes of the interference fringe produced by the GH effect and SHEL, respectively. Figure 2(f) shows the GH shift of the 5G PAMAM-Ag film sample measured at four typical wavelengths, and DGH as a function of wavelength and incident angle. K9 glass is measured to verify the accuracy of the experimental method and compare with the PAMAM-Ag film sample. The positive or negative properties of GH shift can be determined from the results of the K9 glass, and the qualitative phenomenon is the movement direction of interference fringes. The interference fringes (left is higher than right) in Fig. 2(e) show the normal GH shift, and the interference fringes caused by a negative GH shift are opposite. Negative GH shifts are observed at 532, 589, and 671 nm, and the normal GH shift at 473 nm (beyond the resonant wave band). In the measured range, the absolute value of DGH is negatively correlated with the incident angle. The results of these GH shifts are consistent with the position of the resonant wave band in Fig. 1(g), that is, negative GH shifts occur when the wavelength of incident light is in the resonant wave band of the sample. The curves of shift value DSHEL are measured as shown in Fig. 2(g). The results of K9 glass measured at 532 nm are normal, and the measured values are consistent with the reported results [49]. When the incident wavelengths are 532, 589, and 632.8 nm (within the resonant wave band), the direction of DSHEL generated by the 5G PAMAM-Ag is opposite to that of K9 glass, indicating anomalous SHEL. The absolute value of DSHEL increases with the increase in incident wavelength and is positively correlated with the incident angle.

    Experimental measurement of the GH shift and SHEL. Schematic of the experimental setup for (a) GH shift and (b) SHEL. P1, polarizer to obtain linearly polarized light; P2, polarization analyzer to obtain interference fringes in directions of 45° and 135°, respectively; Wollaston prism splits light into two beams, namely, s- and p-polarized light; M, plane mirror; BS, beam splitter; λ/4, quarter-wave plate to obtain RCP and LCP beams. The white board receives the interference pattern, and the CCD records the image. The interference fringes from (c) 45° and (d) 135° P2 are recorded, and then horizontally spliced into an image (e) to calculate the phase difference Δφ1. The results in (c)–(e) come from the GH shift measurement of K9 glass at 632.8 nm. Curves of the relationship between incident angle θ and (f) DGH, (g) DSHEL generated by the 5G PAMAM-Ag at different incident wavelengths. The GH shift at 473, 532, 589, and 671 nm, and the shift of SHEL at 532, 589, and 632.8 nm are measured experimentally. The K9 glass is measured for comparison with the sample.

    Figure 2.Experimental measurement of the GH shift and SHEL. Schematic of the experimental setup for (a) GH shift and (b) SHEL. P1, polarizer to obtain linearly polarized light; P2, polarization analyzer to obtain interference fringes in directions of 45° and 135°, respectively; Wollaston prism splits light into two beams, namely, s- and p-polarized light; M, plane mirror; BS, beam splitter; λ/4, quarter-wave plate to obtain RCP and LCP beams. The white board receives the interference pattern, and the CCD records the image. The interference fringes from (c) 45° and (d) 135° P2 are recorded, and then horizontally spliced into an image (e) to calculate the phase difference Δφ1. The results in (c)–(e) come from the GH shift measurement of K9 glass at 632.8 nm. Curves of the relationship between incident angle θ and (f) DGH, (g) DSHEL generated by the 5G PAMAM-Ag at different incident wavelengths. The GH shift at 473, 532, 589, and 671 nm, and the shift of SHEL at 532, 589, and 632.8 nm are measured experimentally. The K9 glass is measured for comparison with the sample.

    In a previous study, the resonant wave band of the silver dendritic cluster set metasurfaces [7,9] was in the red light band, and the negative GH shift and anomalous SHEL generated by the samples were experimentally observed at 632.8 nm; the hyperbolic metasurface [8] can produce anomalous SHEL at 480–580 nm. Compared with that, PAMAM dendrimer-based silver metamaterials have a wider resonant wave band, which covers at least 532–671 nm in accordance with the experimental results of the negative GH shift and anomalous SHEL. Metamaterial with broadband resonance is conducive to realize the continuous regulation of light, and it contributes to the manufacture of compact and highly integrated devices instead of large volume composite devices.

    C. Slab Focusing Effect

    A slab focusing experiment [35] is performed to further prove the optical properties of PAMAM-Ag [Fig. 3(a)]. The light beam from the focus of the convex lens reaches the sample after 3–5 mm propagation. The inset shows possible situations (focused or divergent) of transmitted light. The intensity distribution of the transmission light is recorded by a fiber optical spectrometer along the x direction. The image of measured field amplitude of a focused beam generated by a 5G PAMAM-Ag film sample at 1050 nm wavelength is shown in Fig. 3(b). A clear point image is focused near the PAMAM-Ag film sample [Fig. 3(b), lower panel], and the distance between the sample and focusing point with maximum light intensity is about 3.75 mm [Fig. 3(b), upper panel]. The results show that the 5G PAMAM-Ag flat lens has a different degree of focusing effect at 450–1500 nm [Fig. 3(c)], and the focusing distance varies from 0.35 to 4.7 mm with wavelength [Fig. 3(d), left axis]. In addition, Fig. 3(d) (right axis) shows the increment of light intensity after focusing relative to that prior to focusing. According to the curves, the 5G sample has the strongest focusing effect at 750–1050 nm, with the maximum focusing light intensity increment of 128% (at 1050 nm). Furthermore, the same measurement was conducted with the 4G PAMAM-Ag flat lens, and the results showed that the 4G sample was effective. However, the focusing wave band was redshifted slightly compared with the 5G sample, and the maximum focusing intensity increment decreased [Figs. 3(e) and 3(f)]. We also measured the pure PAMAM film sample [Fig. 3(g)]; as expected, it did not show any sign of focusing. The slab focusing effect is essentially derived from the negative refraction effect generated by the characteristic resonance of metamaterials [32,33]. According to a previous analysis, the higher generation dendritic macromolecules are more differentiated and have more abundant internal structures. Thus, the higher generation PAMAM-Ag shows superior ability of anomalous manipulation of light.

    Slab focusing effect of PAMAM-Ag. (a) Schematic of the experimental setup for flat lens focusing. Inset scenario 1 corresponds to the scene where the flat lens works; scenario 2 occurs when the beams diverge. Light source, LHX150 tungsten light source and monochromator; ND, neutral density filter; FP, fiber probe; FOS, fiber optical spectrometer. (b) Lower panel: measured field amplitude of focused beam generated by 5G PAMAM-Ag film sample at 1050 nm wavelength with the acceptor moving along the x direction. Color bar: normalized intensity. Upper panel: measured intensity distribution along x direction at the image plane (y=0 mm, marked area). (c) Slab focusing experiment of 5G PAMAM-Ag film sample in visible–near infrared wave band. The 5G PAMAM-Ag film sample has a different degree of focusing effect at 450–1500 nm. The corresponding focusing distance and percentage increment of light intensity after focusing relative to that prior to focusing are shown in (d). (e), (f) Experimental results of 4G PAMAM-Ag thin film sample under the same conditions. (g) Experimental results of pure PAMAM film sample.

    Figure 3.Slab focusing effect of PAMAM-Ag. (a) Schematic of the experimental setup for flat lens focusing. Inset scenario 1 corresponds to the scene where the flat lens works; scenario 2 occurs when the beams diverge. Light source, LHX150 tungsten light source and monochromator; ND, neutral density filter; FP, fiber probe; FOS, fiber optical spectrometer. (b) Lower panel: measured field amplitude of focused beam generated by 5G PAMAM-Ag film sample at 1050 nm wavelength with the acceptor moving along the x direction. Color bar: normalized intensity. Upper panel: measured intensity distribution along x direction at the image plane (y=0  mm, marked area). (c) Slab focusing experiment of 5G PAMAM-Ag film sample in visible–near infrared wave band. The 5G PAMAM-Ag film sample has a different degree of focusing effect at 450–1500 nm. The corresponding focusing distance and percentage increment of light intensity after focusing relative to that prior to focusing are shown in (d). (e), (f) Experimental results of 4G PAMAM-Ag thin film sample under the same conditions. (g) Experimental results of pure PAMAM film sample.

    D. Valley–Hall Topological Properties

    Furthermore, we proposed a 2D visible light valley–Hall PTI [50] inspired by the multilevel nested dendritic structure of the metamaterial PAMAM-Ag to explore potential applications. As we know, various topological photonic structures with nontrivial bands have been proposed, including coupled ring resonator arrays [51,52], meta-crystals [53], and dielectric photonic crystals [54]. However, existing proposals are mostly limited to macroscale dielectric waveguide structures and complex metamaterials with operation frequency limited to the microwave or infrared bands. The multilevel nested dendritic structure may bring a new design in the field of topological photonics. Especially, it is easy to be directly extended to visible bands with micro-nano scale. The structure of PAMAM-Ag [Fig. 1(a)] was transformed into a hexagonal lattice structure with C3v symmetry as shown in Fig. 4(a). A 3D schematic structure of the designed PTI is displayed in the left panel of Fig. 4(a), and details of 2D structure are shown in the right panel. The lattice constant of the 2D hexagonal lattice is a=350  nm. The substrate material is PAMAM (gray part), whose permittivity is 1.812. Ag nanoparticles (blue solid dots) are distributed in the PAMAM, and permittivity of Ag is set to the realistic Drude model value. The unit cell has a four-level branching structure of Ag nanoparticles. The rotation angle φ is used to change the orientation of dendritic silver nanoparticles as a degree of freedom.

    Schematic and band structures of the 2D valley–Hall PTI. (a) 3D schematic and top view of the 2D valley–Hall PTI composed of dendritic structure with four-level branch in hexagonal lattice arrangement. Geometric parameters are a=350 nm, D=18 nm, l1=25 nm, l2=50 nm, l3=85 nm, and l4=125 nm. Angles of l1, l2, l3, and l4 with respect to the horizontal dotted line are 0°, 15°, 30°, and 42°, respectively. The distance between adjacent Ag nanoparticles on the same arc is the same. (b) Band structure of the 2D dendritic structure in (a). The inset shows the first Brillouin zone of the 2D hexagonal lattice. The band structures in (c) and (d) are obtained by rotating the 2D dendritic structures in (a) at φ=−30° and 30° (counterclockwise direction is positive), respectively. K+ and K− represent the corresponding valley states, and the light blue region indicates a complete bandgap. (e), (f) Band structures of three-level branch units at φ=−30° and 30°, respectively.

    Figure 4.Schematic and band structures of the 2D valley–Hall PTI. (a) 3D schematic and top view of the 2D valley–Hall PTI composed of dendritic structure with four-level branch in hexagonal lattice arrangement. Geometric parameters are a=350  nm, D=18  nm, l1=25  nm, l2=50  nm, l3=85  nm, and l4=125  nm. Angles of l1, l2, l3, and l4 with respect to the horizontal dotted line are 0°, 15°, 30°, and 42°, respectively. The distance between adjacent Ag nanoparticles on the same arc is the same. (b) Band structure of the 2D dendritic structure in (a). The inset shows the first Brillouin zone of the 2D hexagonal lattice. The band structures in (c) and (d) are obtained by rotating the 2D dendritic structures in (a) at φ=30° and 30° (counterclockwise direction is positive), respectively. K+ and K represent the corresponding valley states, and the light blue region indicates a complete bandgap. (e), (f) Band structures of three-level branch units at φ=30° and 30°, respectively.

    According to the 2D irreducible representation of the C3v wave vector symmetry group of the hexagonal lattice [55], the double degenerate Dirac points appear at the highly symmetric point K in the first Brillouin zone (BZ) if the mirror symmetry of the unit cell is not broken. As shown in Fig. 4(b), the degenerate Dirac point appears at 550 THz at point K, and the inset shows the first BZ and high symmetry points of the hexagonal lattice. The specular symmetry can be broken by rotating the 2D dendritic structures at an angle φ (the counterclockwise direction is positive). This disturbance increases the energy extremal degeneracy of the Dirac point (at K) and thus breaks the Dirac point to form a complete bandgap. Unit cells with φ=30° and 30° are shown in the inset of Figs. 4(c) and 4(d), respectively, and the corresponding band structures are calculated. The degenerate points at K in the first BZ open to form a pair of frequency extreme points (energy valley states) and form a complete bandgap (550–600 THz) in the green light band, as shown in the light blue band region. The waveguide constructed with the above structures may be applicable to topological transport and bring a new method for the manipulation of visible light. The unit cell with a three-level branch [Figs. 4(e) and 4(f)] is also simulated, and the results are similar to those previously described; however, the bandgap moves toward the red band. In depth, it can be regarded as a multilevel nested structure, which is conducive to adjusting the working frequencies. This finding indirectly responds to the intrinsic reason that the composite metamaterial PAMAM-Ag has a wide resonance wave band.

    3. CONCLUSION

    In summary, we have fabricated a visible light metamaterial covering a large area, by using the PAMAM-assisted metallic photochemical reduction approach. The 5G PAMAM-Ag, composed of Ag nanoparticles distributed in a multilevel netlike sphere, is highly transparent in the visible–near infrared wave band and can generate a negative GH shift and anomalous SHEL at resonant frequencies. Focusing experiments confirm that the 5G PAMAM-Ag flat lens focuses effectively at 750–1050 nm, and the maximum focusing light intensity increment reaches 128% compared with the nonfocusing condition. Moreover, the dendritic structures with a three-level branch and four-level branch are proposed to construct 2D valley–Hall PTIs, and the multilevel nest structure can be used for frequency modulation. This anomalous manipulation of light enables metamaterial to possibly be used in subwavelength super-resolution imaging and quantum optical information fields. Simplifying the expensive and time-consuming preparation process of metamaterials, our method merely requires the reduction of silver with the assistance of high-generation PAMAM regardless of the properties of the substrate, providing a new approach for developing larger-scale visible light metamaterials.

    APPENDIX A: PREPARATION OF PAMAM

    Divergent synthesis is a method to synthesize higher generation products from the center of dendritic macromolecules by extending outward through multiple reaction points. First, ethylenediamine monomer was used as the reaction nucleus to conduct Michael addition reaction with another monomer, methyl acrylate, to obtain half-generation products. Pure half-generation products were obtained by removing excess reactants and by-products through vacuum distillation and extraction methods. Second, the obtained half-generation product was aminated with excess ethylenediamine, and then distillation and extraction were carried out to obtain pure integer-generation dendritic macromolecules. Finally, these steps were repeated to obtain a higher generation of the dendritic PAMAM macromolecule.

    APPENDIX B: PREPARATION OF PAMAM-Ag

    PAMAM and AgNO3 particles were weighed according to the molar ratio nPAMAM:nAgNO3=1:2 (5G PAMAM 1 g, AgNO3  0.024g). First, PAMAM was placed in a 50 mL single-mouth round-bottom flask, and 15 mL ultrapure water was added, stirred, and dissolved by a magnetic blender. Then, the weighed AgNO3 particles were immediately added into the PAMAM aqueous solution and transferred to a constant temperature water bath for magnetic stirring for 24 h. The temperature was set at 25°C, and a completely dark environment was used. After sufficient coordination, they were transferred to a UV cold light lamp for photochemical reduction of Ag, and the composite PAMAM-Ag was finally obtained.

    APPENDIX C: NUMERICAL SIMULATIONS

    The band structures of the unit cells in visible light were calculated by the finite element software COMSOL Multiphysics. The eigenmode propagates in the xy plane, that is, TM (H, Ez) mode. The Floquet periodic boundary conditions were applied to the three pairs of edges of the unit cell. The lattice constant of the 2D hexagonal lattice was a=350  nm. The substrate material was PAMAM, whose permittivity was 1.812. Ag nanoparticles are distributed in the PAMAM according to certain rules, with a diameter of D=18  nm. The permittivity of Ag was set to the realistic Drude model value. Ag nanoparticles of the same level were distributed on the same arc with equal spacing, and the radius of each arc was l1=25  nm, l2=50  nm, l3=85  nm, and l4=125  nm, and angles of l1, l2, l3, and l4 relative to the horizontal dotted line were 0°, 15°, 30°, and 42°, respectively.

    References

    [1] J. Valentine, S. Zhang, T. Zentgraf, E. Ulin-Avila, D. A. Genov, G. Bartal, X. Zhang. Three-dimensional optical metamaterial with a negative refractive index. Nature, 455, 376-379(2008).

    [2] S. P. Burgos, R. de Waele, A. Polman, H. A. Atwater. A single-layer wide-angle negative-index metamaterial at visible frequencies. Nat. Mater., 9, 407-412(2010).

    [3] D. Chanda, K. Shigeta, S. Gupta, T. Cain, A. Carlson, A. Mihi, A. J. Baca, G. R. Bogart, P. Braun, J. A. Rogers. Large-area flexible 3D optical negative index metamaterial formed by nanotransfer printing. Nat. Nanotechnol., 6, 402-407(2011).

    [4] C. Garcia-Meca, J. Hurtado, J. Marti, A. Martinez, W. Dickson, A. V. Zayats. Low-loss multilayered metamaterial exhibiting a negative index of refraction at visible wavelengths. Phys. Rev. Lett., 106, 067402(2011).

    [5] T. Xu, A. Agrawal, M. Abashin, K. J. Chau, H. J. Lezec. All-angle negative refraction and active flat lensing of ultraviolet light. Nature, 497, 470-474(2013).

    [6] A. Lakhtakia. Positive and negative Goos-Hänchen shifts and negative phase-velocity mediums (alias left-handed materials). Int. J. Electron. Commun., 58, 229-231(2004).

    [7] Z. H. Fang, H. Chen, F. S. Yang, C. R. Luo, X. P. Zhao. Slowing down light using a dendritic cell cluster metasurface waveguide. Sci. Rep., 6, 37856(2016).

    [8] A. A. High, R. C. Devlin, A. Dibos, M. Polking, D. S. Wild, J. Perczel, N. P. de Leon, M. D. Lukin, H. Park. Visible-frequency hyperbolic metasurface. Nature, 522, 192-196(2015).

    [9] H. Chen, J. Zhao, Z. Fang, D. An, X. Zhao. Visible light metasurfaces assembled by quasiperiodic dendritic cluster sets. Adv. Mater. Interfaces, 6, 1801834(2019).

    [10] N. Fang, H. Lee, C. Sun, X. Zhang. Sub-diffraction-limited optical imaging with a silver superlens. Science, 308, 534-537(2005).

    [11] J. Rho, Z. Ye, Y. Xiong, X. Yin, Z. Liu, H. Choi, G. Bartal, X. Zhang. Spherical hyperlens for two-dimensional sub-diffractional imaging at visible frequencies. Nat. Commun., 1, 143(2010).

    [12] L. Liu, P. Gao, K. Liu, W. Kong, Z. Zhao, M. Pu, C. Wang, X. Luo. Nanofocusing of circularly polarized Bessel-type plasmon polaritons with hyperbolic metamaterials. Mater. Horiz., 4, 290-296(2017).

    [13] X. Ni, J. W. Zi, M. Mrejen, Y. Wang, X. Zhang. An ultrathin invisibility skin cloak for visible light. Science, 349, 1310-1314(2015).

    [14] L. Y. Beliaev, O. Takayama, P. N. Melentiev, A. V. Lavrinenko. Photoluminescence control by hyperbolic metamaterials and metasurfaces: a review. Opto-Electron. Adv., 4, 210031(2021).

    [15] K. L. Tsakmakidis, A. D. Boardman, O. Hess. ‘Trapped rainbow’ storage of light in metamaterials. Nature, 450, 397-401(2007).

    [16] O. Hosten, P. Kwiat. Observation of the spin Hall effect of light via weak measurements. Science, 319, 787-790(2008).

    [17] V. Shalaev, A. Kildishev, T. Klar, A. Popov, V. Drachev. Optical negative-index metamaterials: from low to no loss. Nat. Photonics, 1, 41-48(2006).

    [18] N. Yu, P. Genevet, M. A. Kats, F. Aieta, J. P. Tetienne, F. Capasso, Z. Gaburro. Light propagation with phase discontinuities: generalized laws of reflection and refraction. Science, 334, 333-337(2011).

    [19] X. Zhao. Bottom-up fabrication methods of optical metamaterials. J. Mater. Chem., 22, 9439-9449(2012).

    [20] K. J. Stebe, E. Lewandowski, M. Ghosh. Materials science. Oriented assembly of metamaterials. Science, 325, 159-160(2009).

    [21] H. Alaeian, J. A. Dionne. Plasmon nanoparticle superlattices as optical-frequency magnetic metamaterials. Opt. Express, 20, 15781-15796(2012).

    [22] K. L. Kelly, E. Coronado, L. L. Zhao, G. C. Schatz. The optical properties of metal nanoparticles: the influence of size, shape, and dielectric environment. J. Phys. Chem., 107, 668-677(2003).

    [23] S. Lee. Colloidal superlattices for unnaturally high-index metamaterials at broadband optical frequencies. Opt. Express, 23, 28170-28181(2015).

    [24] K. L. Young, M. B. Ross, M. G. Blaber, M. Rycenga, M. R. Jones, C. Zhang, A. J. Senesi, B. Lee, G. C. Schatz, C. A. Mirkin. Using DNA to design plasmonic metamaterials with tunable optical properties. Adv. Mater., 26, 653-659(2014).

    [25] D. A. Tomalia, H. Baker, J. Dewald, M. Hall, G. Kallos, S. Martin, J. Roeck, J. Ryder, P. Smith. A new class of polymers: starburst-dendritic macromolecules. Polym. J., 17, 117-132(1985).

    [26] D. A. Tomalia, H. Baker, J. De Wald, M. Hall, G. Kallos, S. Martin, J. Roeck, J. Ryder, P. Smith. Dendritic macromolecules: synthesis of starburst dendrimers. Macromolecules, 19, 2466-2468(1986).

    [27] G. Dang, Y. Shi, Z. Fu, W. Yang. Fe3O4@PS@PAMAM-Ag magnetic nanocatalysts and their recoverable catalytic ability. Chin. J. Catal., 33, 651-658(2012).

    [28] T. Wang, Y. Zhang, L. Wei, Y. G. Teng, T. Honda, I. Ojima. Design, synthesis, and biological evaluations of asymmetric bow-tie PAMAM dendrimer-based conjugates for tumor-targeted drug delivery. ACS Omega, 3, 3717-3736(2018).

    [29] B. Vivek, E. Prasad. Self-assembly-directed aerogel and membrane formation from a magnetic composite: an approach to developing multifunctional materials. ACS Appl. Mater. Interfaces, 9, 7619-7628(2017).

    [30] M. A. van Dongen, S. Vaidyanathan, M. M. B. Holl. PAMAM dendrimers as quantized building blocks for novel nanostructures. Soft Matter, 9, 11188-11196(2013).

    [31] S. Aliannejadi, A. H. Hassani, H. A. Panahi, S. M. Borghei. Fabrication and characterization of high-branched recyclable PAMAM dendrimer polymers on the modified magnetic nanoparticles for removing naphthalene from aqueous solutions. Microchem. J., 145, 767-777(2019).

    [32] X. Zhou, Q. H. Fu, J. Zhao, Y. Yang, X. P. Zhao. Negative permeability and subwavelength focusing of quasi-periodic dendritic cell metamaterials. Opt. Express, 14, 7188-7197(2006).

    [33] H. Liu, X. Zhao, Y. Yang, Q. Li, J. Lv. Fabrication of infrared left‐handed metamaterials via double template-assisted electrochemical deposition. Adv. Mater., 20, 2050-2054(2008).

    [34] S. J. Palmer, X. Xiao, N. Pazos-Perez, L. Guerrini, M. A. Correa-Duarte, S. A. Maier, R. V. Craster, R. A. Alvarez-Puebla, V. Giannini. Extraordinarily transparent compact metallic metamaterials. Nat. Commun., 10, 2118(2019).

    [35] J. B. Pendry. Negative refraction makes a perfect lens. Phys. Rev. Lett., 85, 3966-3969(2000).

    [36] K. Esumi, A. Suzuki, N. Aihara, K. Usui, K. Torigoe. Preparation of gold colloids with UV irradiation using dendrimers as stabilizer. Langmuir, 14, 3157-3159(1998).

    [37] S. Keki, J. Torok, G. Deak, L. Daroczi, M. Zsuga. Silver nanoparticles by PAMAM-assisted photochemical reduction of Ag+. J. Colloid Interface Sci., 229, 550-553(2000).

    [38] U. Kreibig, M. Vollmer. Optical Properties of Metal Clusters(1995).

    [39] F. Goos, H. Hanchen. Ein neuer und fundamentaler Versuch zur Totalreflexion. Ann. Phys., 436, 333-346(1947).

    [40] M. Onoda, S. Murakami, N. Nagaosa. Hall effect of light. Phys. Rev. Lett., 93, 083901(2004).

    [41] S. A. Taya, E. J. El-Farram, T. M. El-Agez. Goos–Hänchen shift as a probe in evanescent slab waveguide sensors. Int. J. Electron. Commun., 66, 204-210(2012).

    [42] Y. Yang, T. Lee, M. Kim, C. Jung, T. Badloe, D. Lee, S. Lee, H.-J. Lee, J. Rho. Dynamic optical spin Hall effect in chitosan-coated all-dielectric metamaterials for a biosensing platform. IEEE J. Sel. Top. Quantum Electron., 27, 7300608(2021).

    [43] R. Wang, J. Zhou, K. Zeng, S. Chen, X. Ling, W. Shu, H. Luo, S. Wen. Ultrasensitive and real-time detection of chemical reaction rate based on the photonic spin Hall effect. APL Photon., 5, 016105(2020).

    [44] A. Shaltout, J. Liu, A. Kildishev, V. Shalaev. Photonic spin Hall effect in gap-plasmon metasurfaces for on-chip chiroptical spectroscopy. Optica, 2, 860-863(2015).

    [45] K. Ando, M. Morikawa, T. Trypiniotis, Y. Fujikawa, C. H. W. Barnes, E. Saitoh. Photoinduced inverse spin-Hall effect: conversion of light-polarization information into electric voltage. Appl. Phys. Lett., 96, 082502(2010).

    [46] M. Kim, D. Lee, T. H.-Y. Nguyen, H.-J. Lee, G. Byun, J. Rho. Total reflection-induced efficiency enhancement of the spin Hall effect of light. ACS Photon., 8, 2705-2712(2021).

    [47] M. Kim, D. Lee, H. Cho, B. Min, J. Rho. Spin Hall effect of light with near-unity efficiency in the microwave. Laser Photon. Rev., 15, 2000393(2020).

    [48] C. Prajapati, D. Ranganathan, J. Joseph. Interferometric method to measure the Goos-Hanchen shift. J. Opt. Soc. Am. A, 30, 741-747(2013).

    [49] C. Prajapati, D. Ranganathan, J. Joseph. Spin Hall effect of light measured by interferometry. Opt. Lett., 38, 2459-2462(2013).

    [50] T. Ma, G. Shvets. All-Si valley-Hall photonic topological insulator. New J. Phys., 18, 025012(2016).

    [51] M. Hafezi, E. A. Demler, M. D. Lukin, J. M. Taylor. Robust optical delay lines with topological protection. Nat. Phys., 7, 907-912(2011).

    [52] M. Hafezi, S. Mittal, J. Fan, A. Migdall, J. M. Taylor. Imaging topological edge states in silicon photonics. Nat. Photonics, 7, 1001-1005(2013).

    [53] A. B. Khanikaev, S. H. Mousavi, W. K. Tse, M. Kargarian, A. H. MacDonald, G. Shvets. Photonic topological insulators. Nat. Mater., 12, 233-239(2013).

    [54] L.-H. Wu, X. Hu. Scheme for achieving a topological photonic crystal by using dielectric material. Phys. Rev. Lett., 114, 223901(2015).

    [55] D. Malterre, B. Kierren, Y. Fagot-Revurat, C. Didiot, F. G. de Abajo, F. Schiller, J. Cordón, J. Ortega. Symmetry breaking and gap opening in two-dimensional hexagonal lattices. New J. Phys., 13, 013026(2011).

    Xianfeng Wu, Zhenchun Li, Yuan Zhao, Chaoshun Yang, Wei Zhao, Xiaopeng Zhao. Abnormal optical response of PAMAM dendrimer-based silver nanocomposite metamaterials[J]. Photonics Research, 2022, 10(4): 965
    Download Citation