• Photonics Research
  • Vol. 11, Issue 10, A54 (2023)
Julius Kullig1、*, Daniel Grom1、3, Sebastian Klembt2, and Jan Wiersig1
Author Affiliations
  • 1Institut für Physik, Otto-von-Guericke-Universität Magdeburg, 39106 Magdeburg, Germany
  • 2Technische Physik and Würzburg-Dresden Cluster of Excellence ct.qmat, Physikalisches Institut and Wilhelm-Conrad-Röntgen-Research Center for Complex Material Systems, Am Hubland, University of Würzburg, 97070 Würzburg, Germany
  • 3e-mail: daniel.grom@ovgu.de
  • show less
    DOI: 10.1364/PRJ.496414 Cite this Article Set citation alerts
    Julius Kullig, Daniel Grom, Sebastian Klembt, Jan Wiersig. Higher-order exceptional points in waveguide-coupled microcavities: perturbation induced frequency splitting and mode patterns[J]. Photonics Research, 2023, 11(10): A54 Copy Citation Text show less
    Illustration of different setups with the corresponding eigenmodes for the realization of higher-order EPs. In the front is an example for an EP6 realized with the proposed scheme consisting of three WG-coupled microrings and a gold mirror. The setup in the background with three WG-coupled microrings is at two EP3s. The arrows show the traveling direction of the confined light.
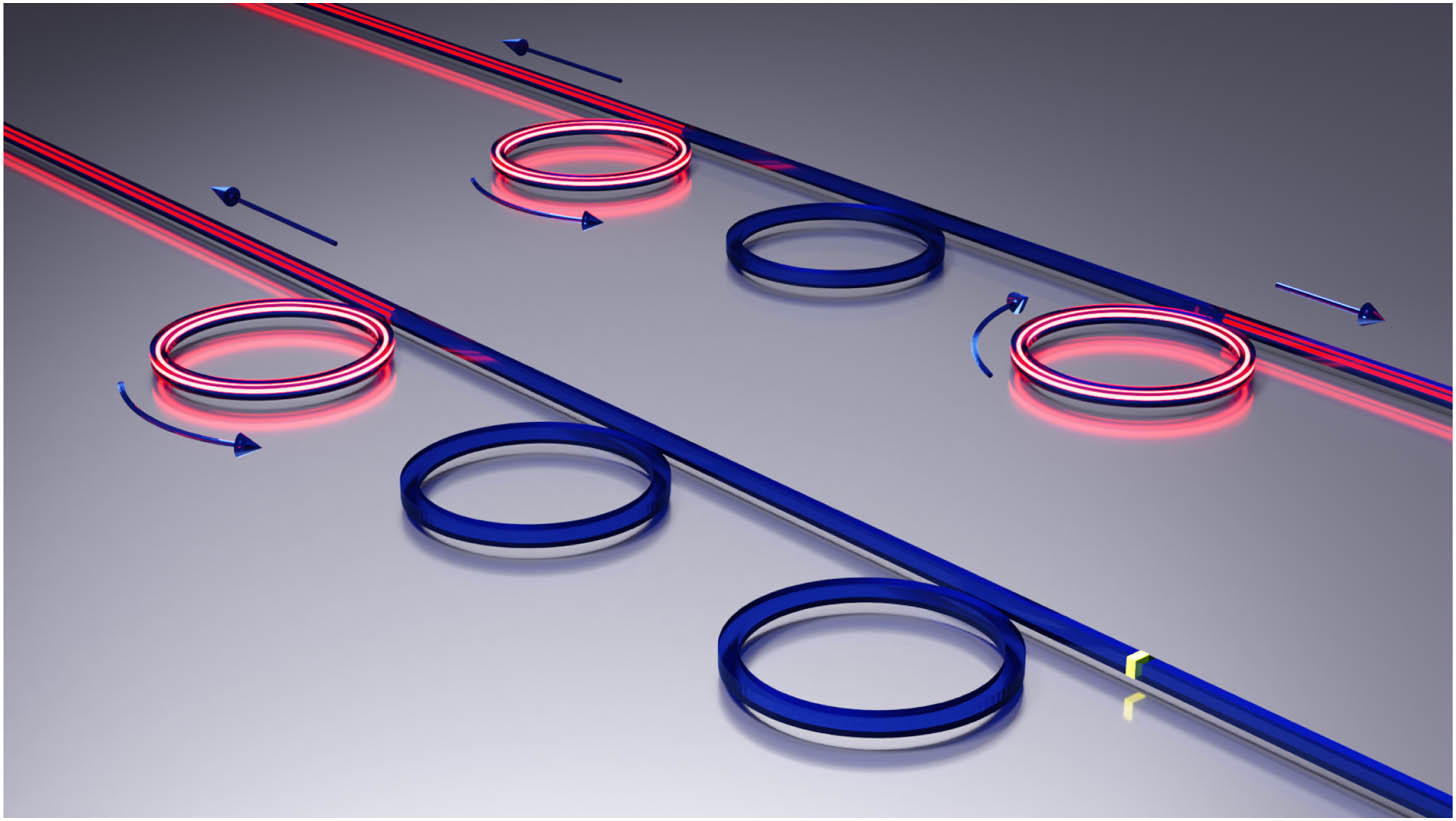
    Fig. 1. Illustration of different setups with the corresponding eigenmodes for the realization of higher-order EPs. In the front is an example for an EP6 realized with the proposed scheme consisting of three WG-coupled microrings and a gold mirror. The setup in the background with three WG-coupled microrings is at two EP3s. The arrows show the traveling direction of the confined light.
    (a) Illustration of two WG-coupled microrings. The WG is infinitely long without backscattering as indicated by the outward pointing arrows. (b), (c) Frequency splitting ΔΩ for the matrix model of two WG-coupled microrings that are perturbed by TPs according to Eqs. (7) and (8). The parameters are Ω=8.31−3.5×10⁻⁴i, A=3.5×10⁻⁴, m=20, ϕTP=π/2, and ϵ∈R+. In (b) D=0; in (c) D=10−9. Gray solid, dashed, and dotted lines serve as guides to the eye for the respective scaling.
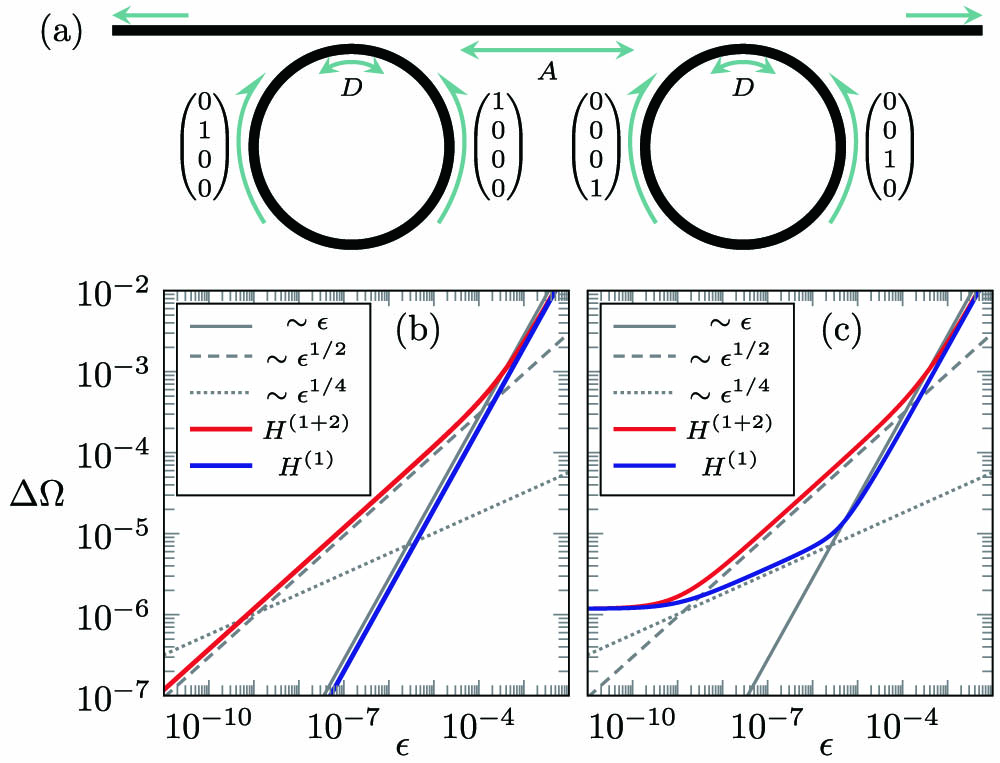
    Fig. 2. (a) Illustration of two WG-coupled microrings. The WG is infinitely long without backscattering as indicated by the outward pointing arrows. (b), (c) Frequency splitting ΔΩ for the matrix model of two WG-coupled microrings that are perturbed by TPs according to Eqs. (7) and (8). The parameters are Ω=8.313.5×104i, A=3.5×10⁴, m=20, ϕTP=π/2, and ϵR+. In (b) D=0; in (c) D=109. Gray solid, dashed, and dotted lines serve as guides to the eye for the respective scaling.
    Illustration of the perturbation-induced splitting around an EP6 with frequency ΩEP. For an increasing perturbation strength ϵ the complex frequencies Ωi (dots) diverge from the EP. The splitting ΔΩ is defined via Eq. (6) as the largest distance between two of the six frequencies for a given perturbation.
    Fig. 3. Illustration of the perturbation-induced splitting around an EP6 with frequency ΩEP. For an increasing perturbation strength ϵ the complex frequencies Ωi (dots) diverge from the EP. The splitting ΔΩ is defined via Eq. (6) as the largest distance between two of the six frequencies for a given perturbation.
    Frequency splitting ΔΩ [Eq. (6)] for two WG-coupled microring cavities calculated with FEM simulations.
    Fig. 4. Frequency splitting ΔΩ [Eq. (6)] for two WG-coupled microring cavities calculated with FEM simulations.
    Mode pattern |ψ| for one of the four modes with Ω≈8.3126−3.5×10⁻⁴i in two WG-coupled microring cavities. Red arrows indicate the propagation direction of the field. The colormap in the simulated domain ranges from blue to yellow.
    Fig. 5. Mode pattern |ψ| for one of the four modes with Ω8.31263.5×104i in two WG-coupled microring cavities. Red arrows indicate the propagation direction of the field. The colormap in the simulated domain ranges from blue to yellow.
    (a) Illustration of the setup with N microring cavities coupled to one semi-infinite WG with a mirror at the right-hand side. (b) The frequency splitting ΔΩ due to a TP with radius rTP at the leftmost cavity is shown. As a guide to the eye the scaling with ∼ϵα is shown from bottom to top for (solid) α=1, (double dashed–dotted) α=1/2, (dotted) α=1/4, (dashed–dotted) α=1/6, and (dashed–double dotted) α=1/8.
    Fig. 6. (a) Illustration of the setup with N microring cavities coupled to one semi-infinite WG with a mirror at the right-hand side. (b) The frequency splitting ΔΩ due to a TP with radius rTP at the leftmost cavity is shown. As a guide to the eye the scaling with ϵα is shown from bottom to top for (solid) α=1, (double dashed–dotted) α=1/2, (dotted) α=1/4, (dashed–dotted) α=1/6, and (dashed–double dotted) α=1/8.
    Mode pattern |ψ| at the EP6 for 3 microring cavities coupled to one WG with a gold mirror at the right side. Red arrows indicate the propagation direction of the field.
    Fig. 7. Mode pattern |ψ| at the EP6 for 3 microring cavities coupled to one WG with a gold mirror at the right side. Red arrows indicate the propagation direction of the field.
    (a) Illustration of three microring cavities coupled to one semi-infinite WG with a gold mirror at the end. The position of a TP is indicated by colored symbols. (b) The frequency splitting ΔΩ due to a TP with radius rTP at cavity 1, 2, or 3 is shown by dots. As a guide to the eye, the scaling with ∼ϵα is shown from bottom to top for (dashed) α=1/2, (dotted) α=1/4, and (dashed–dotted) α=1/6.
    Fig. 8. (a) Illustration of three microring cavities coupled to one semi-infinite WG with a gold mirror at the end. The position of a TP is indicated by colored symbols. (b) The frequency splitting ΔΩ due to a TP with radius rTP at cavity 1, 2, or 3 is shown by dots. As a guide to the eye, the scaling with ϵα is shown from bottom to top for (dashed) α=1/2, (dotted) α=1/4, and (dashed–dotted) α=1/6.
    (a) Illustration of four WG-coupled microring cavities. The WGs are infinitely long without backscattering except for the most upper WG that has a mirror at one end. (b) The frequency splitting ΔΩ due to a TP with radius rTP at the most lower cavity is shown. (c) For a four-microring setup the splitting ΔΩ due to a TP at cavity 1, 2, 3, or 4 (from bottom to top) is shown. Filled symbols are results from the FEM simulation. The corresponding open symbols are calculated from the effective Hamiltonian. The lines in (b) and (c) serve as guides to the eye and represent the scaling ∼ϵα with (solid) α=1, (double dashed–dotted) α=1/2, (dotted) α=1/4, (dashed–dotted) α=1/6, and (dashed–double dotted) α=1/8.
    Fig. 9. (a) Illustration of four WG-coupled microring cavities. The WGs are infinitely long without backscattering except for the most upper WG that has a mirror at one end. (b) The frequency splitting ΔΩ due to a TP with radius rTP at the most lower cavity is shown. (c) For a four-microring setup the splitting ΔΩ due to a TP at cavity 1, 2, 3, or 4 (from bottom to top) is shown. Filled symbols are results from the FEM simulation. The corresponding open symbols are calculated from the effective Hamiltonian. The lines in (b) and (c) serve as guides to the eye and represent the scaling ϵα with (solid) α=1, (double dashed–dotted) α=1/2, (dotted) α=1/4, (dashed–dotted) α=1/6, and (dashed–double dotted) α=1/8.
    Mode pattern |ψ| at the EP8 for four microring cavities coupled via WGs and a gold mirror. Red arrows indicate the propagation direction of the field.
    Fig. 10. Mode pattern |ψ| at the EP8 for four microring cavities coupled via WGs and a gold mirror. Red arrows indicate the propagation direction of the field.
    Relative intensity in each microring averaged over the eight modes in a four-ring setup perturbed by a TP is shown. The cavities are counted from bottom to top [(d) to (a)] in correspondence to the cavity position in Fig. 10. Filled symbols are results from the FEM simulation for a TP at a given cavity. The corresponding open symbols are calculated from the effective Hamiltonian.
    Fig. 11. Relative intensity in each microring averaged over the eight modes in a four-ring setup perturbed by a TP is shown. The cavities are counted from bottom to top [(d) to (a)] in correspondence to the cavity position in Fig. 10. Filled symbols are results from the FEM simulation for a TP at a given cavity. The corresponding open symbols are calculated from the effective Hamiltonian.
    Eigenfrequencies in complex plane for (a)–(e) four-ring and (f)–(j) two-ring setups [see Fig. 9(a)]. The color represents a variation of the TP angle ϕTP from π/2 to π/2−π/m with m=20 being the azimuthal mode number. The TP is placed at the most lower cavity. From left to right the radius of the TP is increased. Filled dots are results from the FEM simulations. Open circles are calculated from the effective Hamiltonian. The markers lie nearly on top of each other.
    Fig. 12. Eigenfrequencies in complex plane for (a)–(e) four-ring and (f)–(j) two-ring setups [see Fig. 9(a)]. The color represents a variation of the TP angle ϕTP from π/2 to π/2π/m with m=20 being the azimuthal mode number. The TP is placed at the most lower cavity. From left to right the radius of the TP is increased. Filled dots are results from the FEM simulations. Open circles are calculated from the effective Hamiltonian. The markers lie nearly on top of each other.
    Reflection spectra R(ω) for the (a) two-ring and the (b) four-ring setups are shown [see Fig. 9(a)], with a TP at the respective most lower cavity. The angle ϕTP is varied from π/2 to π/2−π/m with m=20. The TP has a radius rTP=0.03R. Solid curves are the full numerical results and dashed curves are computed with the effective Hamiltonian.
    Fig. 13. Reflection spectra R(ω) for the (a) two-ring and the (b) four-ring setups are shown [see Fig. 9(a)], with a TP at the respective most lower cavity. The angle ϕTP is varied from π/2 to π/2π/m with m=20. The TP has a radius rTP=0.03R. Solid curves are the full numerical results and dashed curves are computed with the effective Hamiltonian.
    Reflection spectra R(ω) for a setup with N microring cavities at an EP2N [see Fig. 9(a)]. Colored curves are results from full numerical simulations. Dashed curves represent a fit with the 2N powers of the function L(ω)∼|ω−ΩEP|−2.
    Fig. 14. Reflection spectra R(ω) for a setup with N microring cavities at an EP2N [see Fig. 9(a)]. Colored curves are results from full numerical simulations. Dashed curves represent a fit with the 2N powers of the function L(ω)|ωΩEP|2.
    Absolute values of the parameters V and U from the perturbation matrix with respect to radius rTP of the TP. The line serves as a guide to the eye and represents the scaling proportional to rTP2.
    Fig. 15. Absolute values of the parameters V and U from the perturbation matrix with respect to radius rTP of the TP. The line serves as a guide to the eye and represents the scaling proportional to rTP2.
    Julius Kullig, Daniel Grom, Sebastian Klembt, Jan Wiersig. Higher-order exceptional points in waveguide-coupled microcavities: perturbation induced frequency splitting and mode patterns[J]. Photonics Research, 2023, 11(10): A54
    Download Citation