Dun Liu, Shibin Wu, Wei Yang, Lihua Wang, Bin Fan, Fan Wu. Effects of mask-alignment error on point spread function for multi-level Fresnel diffractive lenses[J]. Chinese Optics Letters, 2018, 16(9): 090501
Copy Citation Text
The full aperture complex amplitude transmittance function of a multi-level diffraction lens with mask-alignment errors was derived based on scalar diffraction theory. The point spread function (PSF) was calculated by the Kirchhoff diffraction integral. It is found that the radius of the Airy disk increases with the increase of the error in the direction of misalignment, and the image center shifts along the direction of misalignment. A four-level diffractive lens with a diameter of 80 mm was fabricated, and its PSF and diffraction efficiency of st order were calculated and measured. The distribution of PSF is consistent with the calculated results, and the tested diffraction efficiency is slightly smaller than the calculated value; the relative error is 5.71%.
Recently, some institutes have evaluated diffractive lenses as primary lenses for telescopes[1–4]. These studies are exploring the novel technology to build space and airborne telescopes with an aperture larger than 10 m. At present, the main surface microstructures of Fresnel diffractive lens include the Fresnel zone plate (FZP), photon sieve, and Fresnel array[5]. The diffraction efficiency of the FZP is higher than that of the other two microstructures and can be improved by being fabricated into multi-level. The diffraction efficiency of a eight-level structure can reach 95% according to the scalar theory[6]. While, due to the inevitable fabrication errors, the performance of the Fresnel zone lens (FZL) will degrade, some articles have reported the fabrication of large-aperture four-level FZL, but the diffraction efficiency has not reached the expected value[7–9]. For example, Britten et al. reported that the diffraction efficiency of a four-level FZL with an aperture of 300 mm was only 62%[8], while the theoretical value is 81.06%. Several authors have studied the effects of fabrication errors on the diffraction efficiency of binary optical elements based on the linear grating model[10–12]. They found that mask-alignment errors severely degrade the diffraction efficiency. However, the imaging quality of FZLs cannot be simply evaluated by diffraction efficiency. To assess the effects of mask-alignment errors on the imaging quality of four-level diffractive lenses, Unno studied the point spread function (PSF) of binary diffractive lenses with mask-alignment error[13]. In his Letter, the PSF is calculated by the Debye integral in the research. It is accurate under the condition [14] or expressed as . If the number (F) of the diffractive lens is a constant, the approximation condition is gradually invalidated as aperture D is increased. On the other hand, the derivation of pupil function is complicated, and locally periodic approximation is used in his model. In this Letter, the influence of the mask-alignment error on the complex amplitude transmittance of the diffractive lens is derived. Then, the PSF is calculated by the Kirchhoff diffraction integral without paraxial approximation. To solve the problem of the large size of diffractive lens, the idea of sub-aperture synthesis is applied in the calculation. Through numerical calculation, the PSF of the four-level diffractive lens with an aperture of 80 mm is studied under different mask-alignment errors. At the end, the PSF and the diffraction efficiency in the order of an experimental diffractive lens were tested and compared with the calculated results.
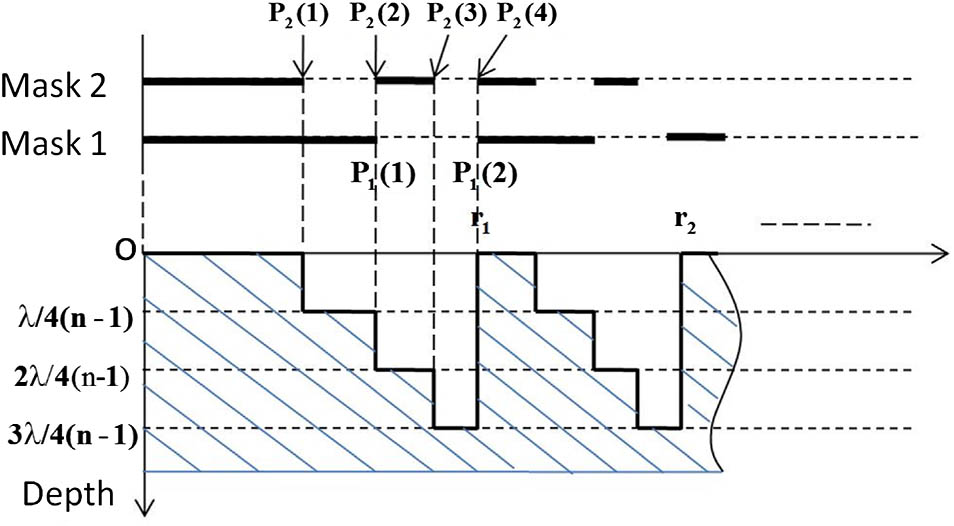
Lithography is a common method for processing binary optics[15]. The key is to transfer the pattern position of the mask to the substrate. Figure 1 shows the relative configuration between the two mask patterns and the final surface profile in the radial direction. The black zone of each mask is opaque, and the white zone is transparent.
Figure 1.Surface structure of four-level in relation to the two mask patterns.
By use of N mask patterns, a -level FZL can be fabricated. For an FZL with focal length of and the design wavelength of , the position of transition points of the th mask is decided by where is the radius of the th zone of the th mask. In the actual design, the diffractive lens is described by a phase polynomial for tracing the rays passing through the element[16]. Equation (1) is usually written as where is the diffraction order, is the number of polynomial coefficients in the series, and is the coefficient. It is necessary to etch the substrate once during the pattern transfer process of each mask. The etching depth in relation to the th mask is
Sign up for Chinese Optics Letters TOC. Get the latest issue of Chinese Optics Letters delivered right to you!Sign up now
According to the scalar diffraction theory, the complex amplitude transmittance function of the FZL can be expressed as , where is the amplitude function and is generally uniform; is the phase function and depends on where where is the refractive index of the substrate. It can be seen from Eq. (5) that there are two types of errors affecting the phase distribution function. One is the etching depth error, which determines the value of phase delay. The other is the lateral error, which determines whether is zero or not.
When there is an alignment error, the coordinate system of the mask is shifted relative to the coordinate system of the diffractive lens, which is overlapped with the coordinate system of the first mask. The position (, ) of the th zone of the th mask should be transformed into (, ) in the coordinate system of the diffractive lens. and represent the absolute offset between the center of the th mask and the first mask in the and directions. Figure 2 shows the phase distribution function of a four-level diffractive lens with misalignment. The direction of the red arrow is the direction in which the error occurs.
Figure 2.Phase distribution of a four-level diffractive lens with misalignment.
Based on the above description, the complex amplitude transmittance function of the multi-level diffractive lens with mask-alignment errors can be obtained. Suppose that the complex amplitude of the incident wave is , and the diffractive field behind the FZL is . So, the light field distribution at the focal plane of the lens can be calculated according to the famous Kirchhoff diffraction integral: where , is the wavelength with , and is the diffractive distance. According to the convolution theorem, Eq. (6) can be written as[17]where FFT and IFFT are the fast Fourier transform and inverse fast Fourier transform; the transfer function is
During the numerical calculation, the entire function’s sampling needs to meet the sampling theory[18], that is, where is the spatial sampling interval, and is the width of the diffraction field.
For a large-aperture diffractive lens, the required sampling number is too large to store and calculate. To solve this problem, the diffraction lens is divided into a number of rectangular sub-apertures according to the principle of linear superposition of diffraction. Let the center coordinate of each sub-aperture be (, ), and the widths of each sub-aperture along the and directions be , . Then, at the focal plane, the optical field can be expressed as
In this Letter, we designed and fabricated a four-level diffractive lens with the aperture of 80 mm. The focal length is 800 mm at the wavelength of 550 nm. The first five coefficients of the phase polynomial are , , , , and . The PSFs of the FZL with different mask-alignment errors were numerically calculated separately. Figures 3(a) and 3(b) show the normalized intensity distribution in the direction and the direction, respectively.
In this Letter, the axis is perpendicular to the misalignment direction, and the axis is parallel to the misalignment direction. That is to say, the alignment error occurs in the direction. In the direction, the image center shifts along the misalignment direction, as shown in Fig. 4. The offset is decreased linearly as the amount of the error increases.
Figure 4.Center offset with the change of misalignment.
In the direction, the radius of the Airy disk, which is the half-width of the image at the first dark ring, decreased with the increase of error in the way of the quadratic, as shown in Fig. 5. However, in the direction, it slowly decreases.
Figure 5.Radius of Airy disk with the change of misalignment.
When the mask-alignment error is greater than 1.8 μm, the details of the first dark ring are submerged in the direction of the error. Figure 6 shows the PSF of the lens with a misalignment error of 1.8 μm and the cross section of PSF in the direction.
Figure 6.PSF with the misalignment of 1.8 μm. (a) is the distribution of PSF, and (b) is the cross-section distribution in the direction.
Diffraction efficiency is the ratio of the energy diffracted into of the total incident energy. If the phase distribution of the FZL is continuous in each zone, all incident energy will focus in order at the design wavelength. So, in this Letter, the efficiency is defined as the sum intensity at the focal plane to the sum intensity of the ideal diffractive lens at focal plane. Figure 7 shows the variation of diffraction efficiency with the change of misalignment. The diffraction efficiency without alignment error is 81.06%, which is the same as the calculated value according to the Ref. [6]. But, it decreases linearly as the amount of the error increases. When the misalignment error is 2 μm, the efficiency is only about 45%.
Figure 7.Diffraction efficiency with the change of misalignment.
The four-level FZL with the aperture of 80 mm was fabricated, and the micrographs were measured by the ZYGO NewView 7300 optical three-dimensional (3D) profilers. Figure 8 shows the surface profile at the outmost zones of the FZL in the direction of misalignment. The mask-alignment error is 0.83 μm.
Figure 8.(a) The micrographs of the 80 mm FZL at the outmost zones; (b) is the cross-section profile along the line in (a).
The step depth was also measured at different positions, as shown in Fig. 9. In this Letter, the average etch depth is used to characterize the overall etch depth of the lens. The values of and in the Eq. (3) are 638.7 and 280.5 nm, respectively. The relative line width error is less than 0.4% at the edge zones and will be smaller at the center zones. So, during the calculation, this error was ignored.
Figure 9.Depth error of the 80 mm FZL at different positions.
Due to the large dispersion of diffractive lens, the PSF can only be accurately analyzed and tested with a single wavelength. It is difficult to obtain a stable plane wave at the wavelength of 550 nm. The light source from ZYGO interferometer with the wavelength of 632.8 nm was used because it is very convenient to obtained and the wave aberration of the FZL at 632.8 nm is still very small. Figure 10 shows the test process of PSF. The test principle refers to the method in literature[19]. The nominal magnification of the microscope objective lens is 40. Before test, the magnification was calibrated by using the , , and lines of No. 4 resolution target in the national standard JBT 9328–1999[20], and the relative error is less than 0.5%.
In order to show the details of the PSF, the exposure time of the CCD was appropriately increased. One of the test results is shown in Fig. 11(a). As a comparison, the PSF of the FZL with the quantized fabrication errors at the wavelength of 632.8 nm (the focal length is 695.1 mm) was calculated and shown in Fig. 11(b). During the test and calculation, the direction of misalignment is set to parallel the direction. The calculated distributions of normalized intensity in the and directions are shown in Fig. 12. The radius of the Airy disk is 6.6 μm in the direction and 7.1 μm in the direction. The image center shifted from the optical axis with 0.3 μm along the direction of misalignment. For each tested PSF image, the boundary of the Airy disk was extracted through the connected region method[21] and then fitted as an ellipse. The red ellipse in Fig. 11(a) is the fitted boundary of the Airy disk, and the line with an arrow is the long axis of the ellipse. We acquired six images of the PSF and performed the same process. Table 1 shows the parameters of the fitted ellipse. The angle between the long axis and the direction is very small. It shows that the direction of the long axis fluctuates in the vertical direction, which is very close to the direction of the misalignment. The average radius of the Airy disk is 7.19 μm along the long axis and 6.90 μm along the short axis. Both of the radii are slightly larger than the calculated values. The main reason may be the ignorance of the line width error and the sidewall tilt of the microstructures.
Figure 11.PSF of the 80 mm FZL. (a) is the test result, and (b) is the calculated result.
The -order diffraction efficiency of the FZL was also measured at the wavelength of 632.8 nm. The power fluctuations at 10 m of the source are less than 0.23%, and the environmental background noise to the total incident energy is less than 0.15%. The transmittance of the substrate was also deducted from the final results. The diffraction efficiency of the order is 61.06%, while the calculated value is 64.76%. The difference is very small, and the relative error is 5.71%. Except for the measurement errors, some ignored fabrication errors, such as line width errors and the slanted sidewall of the microstructures, are the main factors that cause the differences.
In conclusion, the influence of mask-alignment error on the imaging quality of large-aperture diffractive lens was analyzed. The complex amplitude transmission function with fabrication was derived, and the PSF was calculated by the Kirchhoff diffraction integral. The linear superposition theory of diffraction was used to solve the problem of large size diffraction calculation. Simulation results of the four-level diffractive lens show that the diffraction efficiency decreases linearly with the increasing of the mask-alignment error. In the misalignment direction, the radius of the Airy disk decreased with the increasing of error in the way of the quadratic. However, in the direction, it slightly decreases.
Meanwhile, the offset of the image center increases linearly with the increasing of the misalignment. When the mask-alignment error is greater than 1.8 μm, the details of the first dark ring are submerged in the direction of the error. The amount of this error may be a little different for diffractive lenses with different parameters.
For FZLs with more levels, the PSF and diffraction efficiency can also be analyzed by this method, but the mask-alignment errors are more complex. In the future, the effects of fabrication errors of large-aperture membrane diffractive lens on the imaging quality will be studied.
References
[1] W. Yang, S. Wu, L. Wang, B. Fan, X. Luo, H. Yang. Opto-Electron. Eng., 44, 475(2017).
[2] P. Atecheson, J. Domber, K. Whiteaker, J. A. Britten, S. N. Dixit. Proc. SPIE, 9143, 91431W(2014).
Dun Liu, Shibin Wu, Wei Yang, Lihua Wang, Bin Fan, Fan Wu. Effects of mask-alignment error on point spread function for multi-level Fresnel diffractive lenses[J]. Chinese Optics Letters, 2018, 16(9): 090501