• Laser & Optoelectronics Progress
  • Vol. 57, Issue 3, 031202 (2020)
Zhongsheng Zhai1、*, Jiaojie Huang1, Hang Zhao1, Jinsong Li1, Qinghua Lü2, and Xuanze Wang1
Author Affiliations
  • 1Hubei Key Laboratory of Modern Manufacturing Quantity Engineering, School of Mechanical Engineering, Hubei University of Technology, Wuhan, Hubei 430068, China
  • 2School of Science, Hubei University of Technology, Wuhan, Hubei 430068, China
  • show less
    DOI: 10.3788/LOP57.031202 Cite this Article Set citation alerts
    Zhongsheng Zhai, Jiaojie Huang, Hang Zhao, Jinsong Li, Qinghua Lü, Xuanze Wang. Intensity Consistency Control Method for Multi-Wavelength Micro-Interferometry[J]. Laser & Optoelectronics Progress, 2020, 57(3): 031202 Copy Citation Text show less
    Schematic diagram of light intensity consistency interferometry system
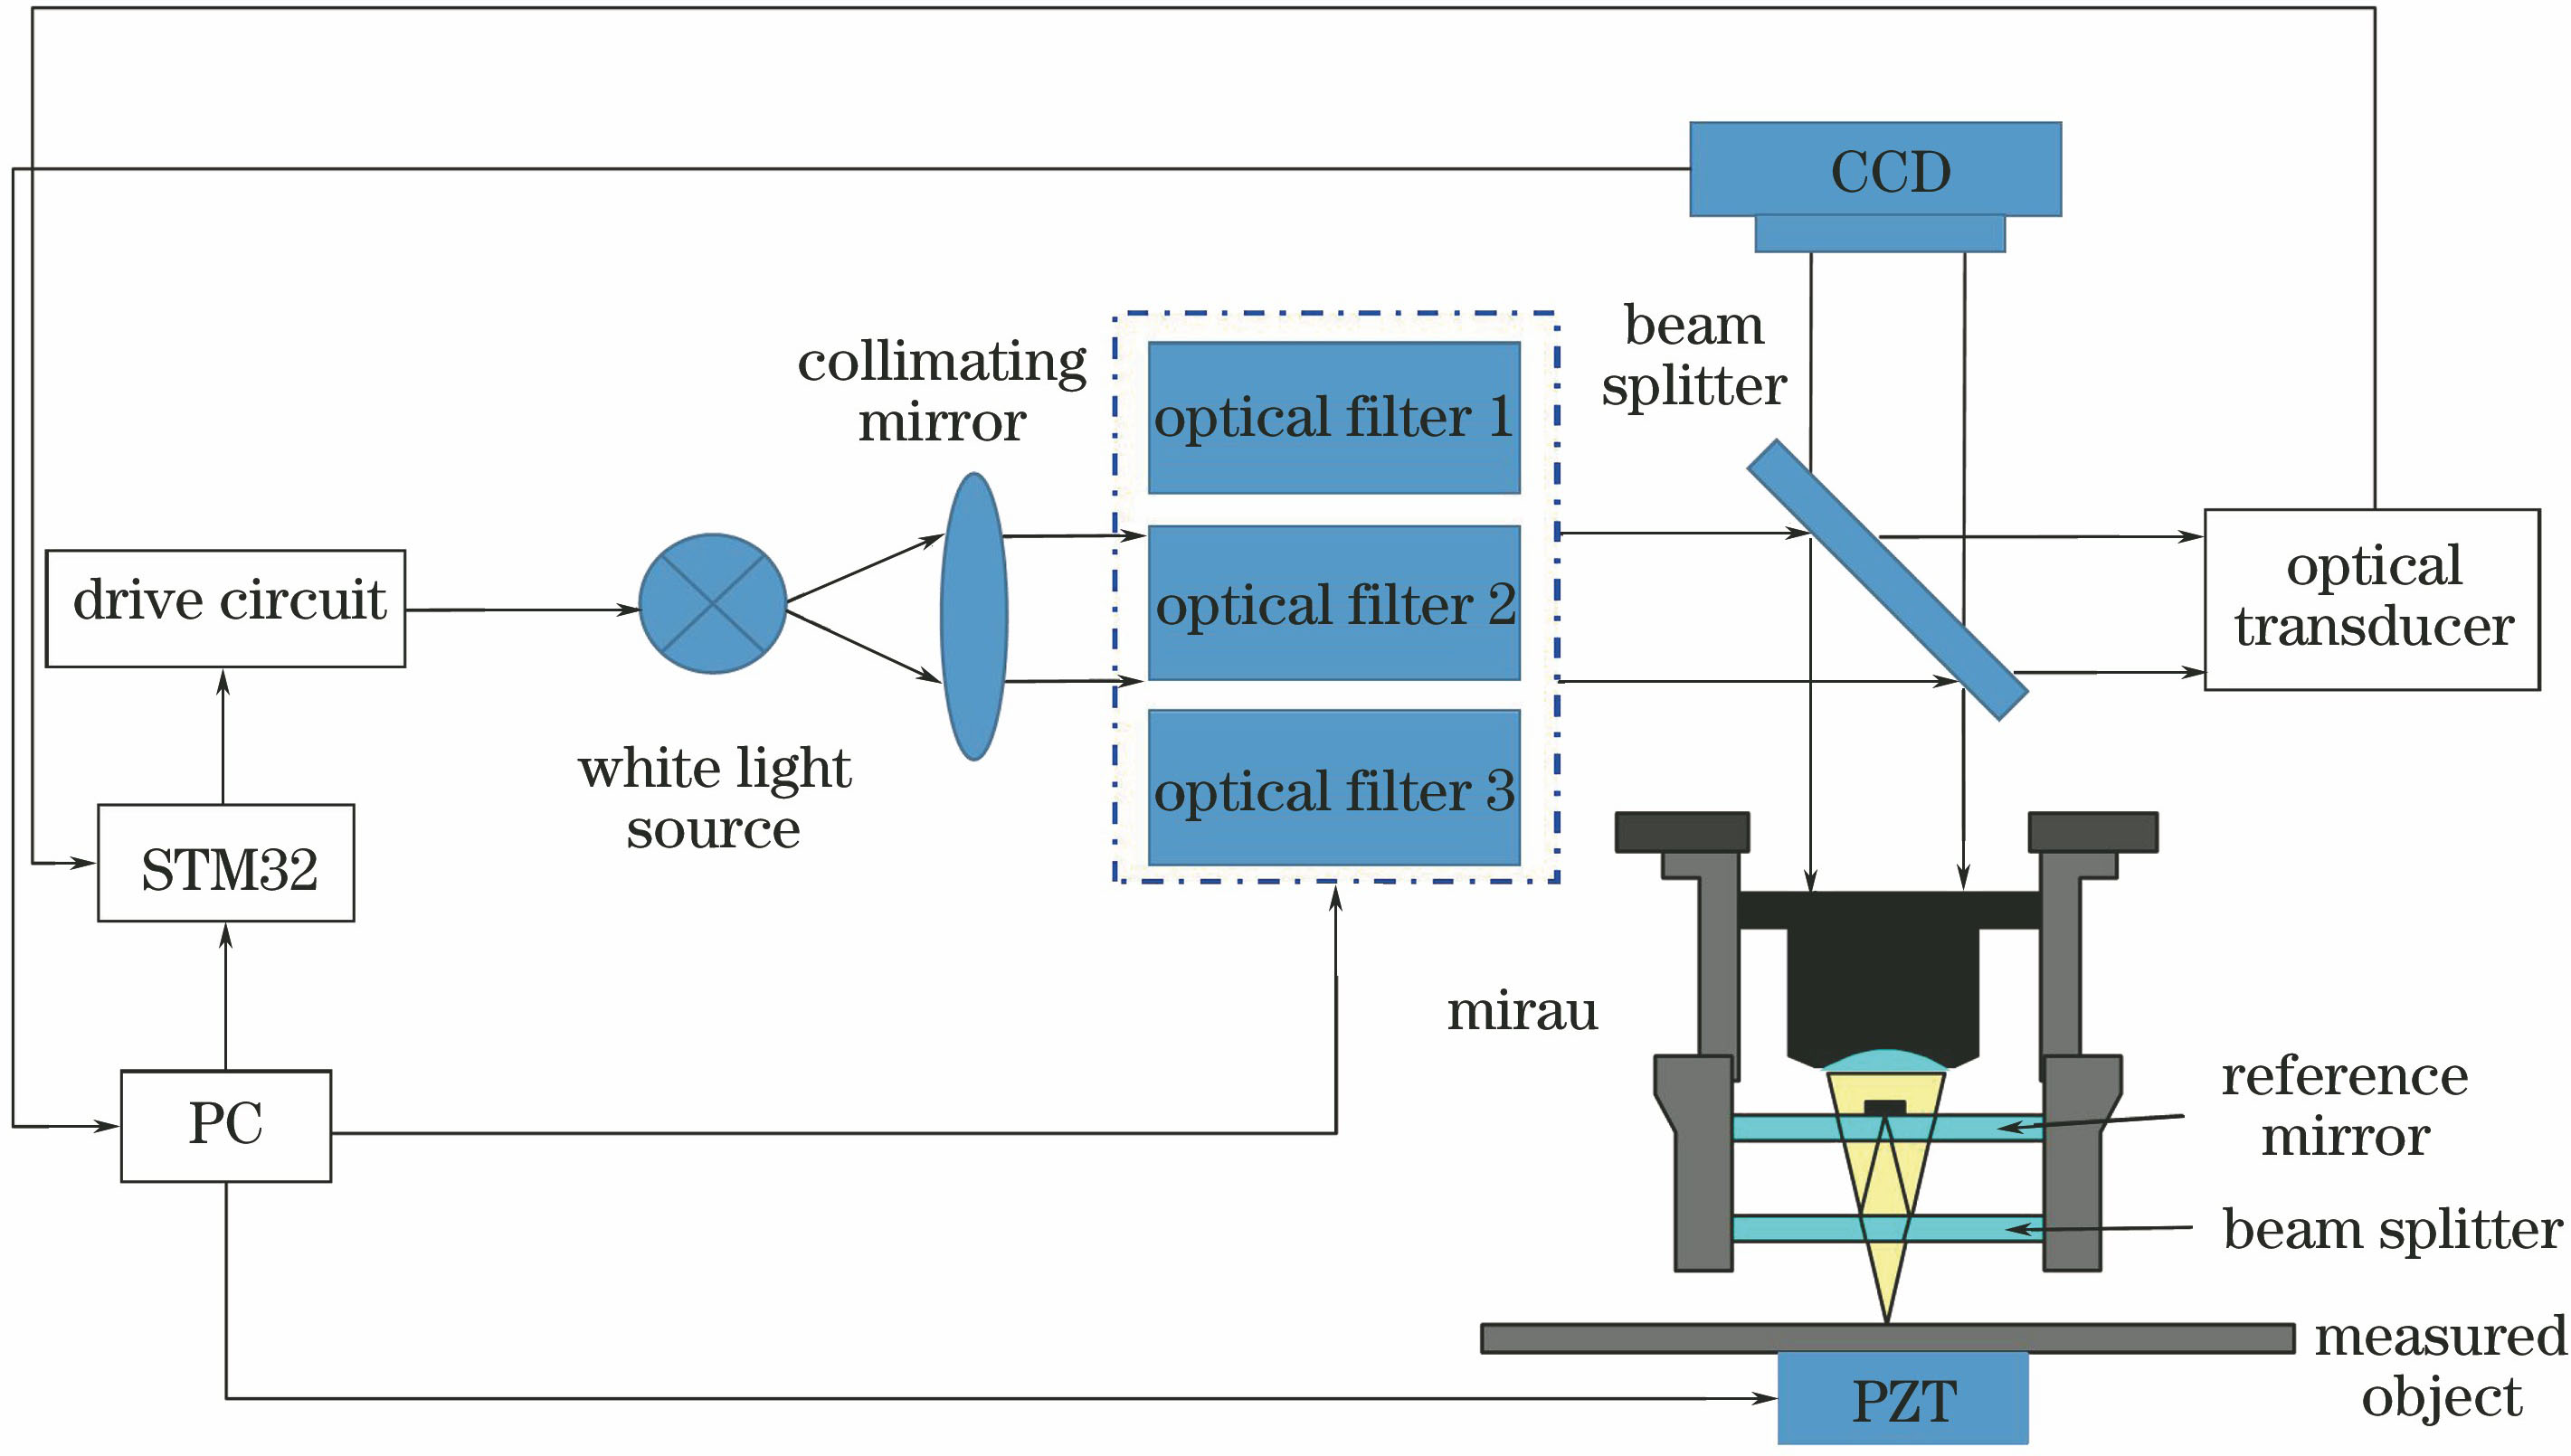
    Fig. 1. Schematic diagram of light intensity consistency interferometry system
    Spectral characteristic curve of white light source
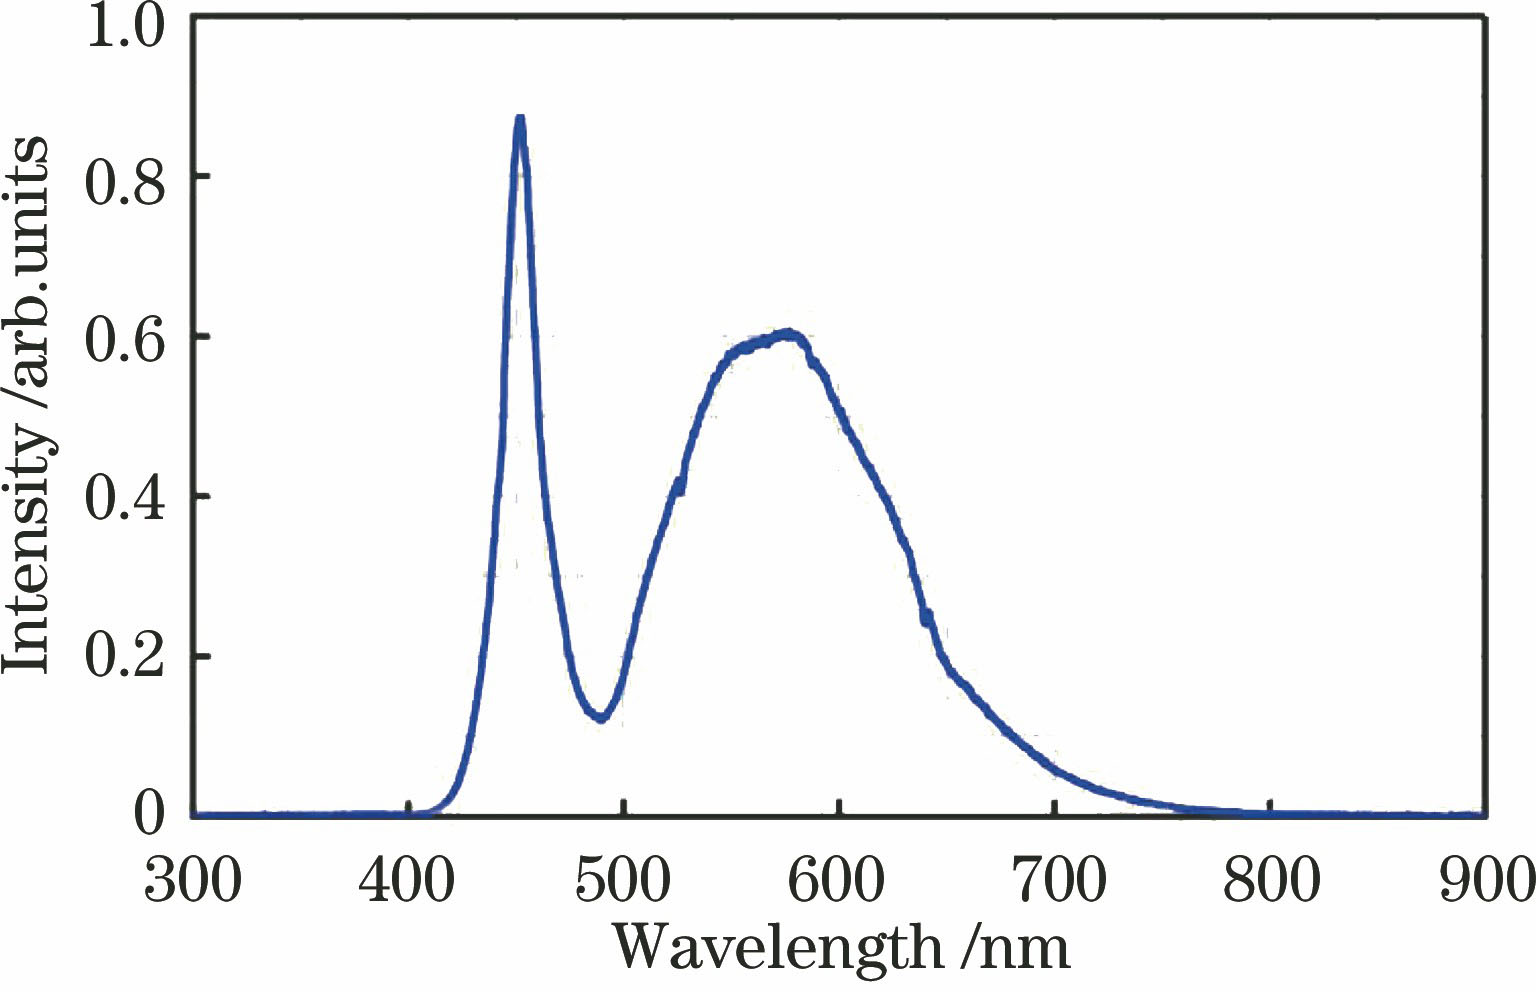
    Fig. 2. Spectral characteristic curve of white light source
    System control block diagram
    Fig. 3. System control block diagram
    LED driving circuit
    Fig. 4. LED driving circuit
    Diagram of light intensity dynamic curve during switching process
    Fig. 5. Diagram of light intensity dynamic curve during switching process
    System step response
    Fig. 6. System step response
    Illuminance dynamic curve during wavelength rotation
    Fig. 7. Illuminance dynamic curve during wavelength rotation
    Interferograms before and after intensity control. (a)(d) 510 nm interferograms before and after intensity control; (b)(e) 540 nm interferograms before and after intensity control; (c)(f) 640 nm interferograms before and after intensity control
    Fig. 8. Interferograms before and after intensity control. (a)(d) 510 nm interferograms before and after intensity control; (b)(e) 540 nm interferograms before and after intensity control; (c)(f) 640 nm interferograms before and after intensity control
    Vertical grayscale projections before and after intensity control. (a) Before intensity control; (b) after intensity control
    Fig. 9. Vertical grayscale projections before and after intensity control. (a) Before intensity control; (b) after intensity control
    Serial numbert2 /st3 /s
    12.361.62
    22.221.62
    32.301.76
    42.201.62
    52.241.70
    Table 1. Light intensity adjustment schedule
    Wavelength /nmBefore intensity controlAfter intensity control
    Maximumgray valueMinimumgray valueKMaximumgray valueMinimumgray valueK
    5102407745480.68986029190.54
    5407233890200.781034529290.56
    6401199630170.601036030270.55
    Table 2. Visibility of three-wavelength interference image
    Zhongsheng Zhai, Jiaojie Huang, Hang Zhao, Jinsong Li, Qinghua Lü, Xuanze Wang. Intensity Consistency Control Method for Multi-Wavelength Micro-Interferometry[J]. Laser & Optoelectronics Progress, 2020, 57(3): 031202
    Download Citation