
Yisi Dong, Peng-Cheng Hu, Haijin Fu, Hongxing Yang, Ruitao Yang, Jiubin Tan, "Long range dynamic displacement: precision PGC with sub-nanometer resolution in an LWSM interferometer," Photonics Res. 10, 59 (2022)
- Photonics Research
- Vol. 10, Issue 1, 59 (2022)
Abstract
1. INTRODUCTION
Recently, fiber laser interferometry technology has undergone rapid development. Unlike the traditional interference system based on a discrete mirror group, the fiber-optic interference system has the advantages of compact structure, convenient adjustment of optical path, anti-corrosive properties, and suitability for measurements in extreme environments, hence meeting the high stability and precision embedded measurement requirements [1,2].
There are two kinds of fiber-optic interferometers. One has a fiber-optic coupler [3,4], with its measurement and reference arms in two fibers. This setup is sensitive to external environment factors, such as temperature and stress, making it difficult to achieve high-precision measurements. The other is the micro structure [5], which comprises an optical fiber collimator and spectroscope that can achieve high-precision measurement and is considered as the main research hotspot.
Demodulation technology largely determines the performance of fiber-optic displacement measurement. Based on broadband light sources, a white light interferometer can realize cavity length measurement with sub-nanometer resolution [6]. Although this technology is mature, it is used only for quasi-static measurement and cannot meet the requirement of dynamic measurement. To realize fast signal demodulation, quadrature point intensity demodulation is widely used [7,8], but its dynamic range is limited (
Sign up for Photonics Research TOC. Get the latest issue of Photonics Research delivered right to you!Sign up now
PGC technology requires a high-frequency carrier phase signal, which is generated by modulating the laser wavelength and combining the idle length of the interferometer. This is referred to as a laser wavelength sinusoidal modulation (LWSM) fiber-optic interferometer. However, for this interferometer, the carrier phase delay (CPD), accompanied optical intensity modulation (AOIM), and phase modulation depth (PMD) in PGC demodulation can lead to large errors and even fail to demodulate, which severely restricts the displacement measurement accuracy.
Numerous CPD compensation methods [11,12] have been proposed without the consideration of AOIM. Although they were experimentally verified, none of them can be applied to phase delay compensation in PGC demodulation units affected by AOIM. Researchers from Tianjin University [13] proposed to eliminate AOIM by double photoelectric detection and division operation; however, the double channel synchronization is difficult to realize due to different fiber paths that may induce errors, especially when the modulation frequency reaches the MHz region [14]. To realize accurate double channel synchronization, the fiber delay chain is used, but it is suitable only for short-term measurement in a stable environment due to the instability of two channels.
For PMD control, researchers at St. Petersburg National University [15] used the first four harmonics of the interference signal to realize the stability of PMD. However, the system does not function normally when the phase to be measured is in
The above two systems function normally when the phase to be measured is in
In addition to the above methods, a classical ellipse fitting method [18] simultaneously deals with the effects of three parameters. However, pre-obtained data are necessary for ellipse fitting. Ellipse fitting with combined sinusoidal and triangular modulation [19] was used to obtain pre-data. However, for the LWSM fiber-optic interferometer, the Lissajous diagram of the system is a straight line in numerous cases, such that the above ellipse fitting method cannot be used.
In this study, to solve the above problems and realize precision PGC demodulation in the LWSM fiber-optic interferometer, orthogonal detection and an AC-DC component extraction scheme are used to obtain the CPD and laser intensity modulation phase delay (LIMPD) simultaneously, which uses single channel detection to avoid the asynchronous problem of double channel detection. AOIM and CPD can be effectively eliminated at the same time. By combining frequency sweeping interference and modified PGC-arctan demodulation to measure real-time working distance, the PMD adaptive method is realized based on proportion control, which works including all initial positions and dynamic movements under the normal working distance of the sensing probe and requires less memory resources.
In Section 2, the influence of CPD, AOIM, and PMD in PGC demodulation is analyzed, and a novel precision PGC demodulation is described in detail. The experimental setup and verified experiments are given in Section 3.
2. PRINCIPLE AND METHOD
A. Effects of AOIM and CPD in PGC Demodulation
In the LWSM fiber-optic interferometer, the optical path difference of the interferometer is modulated, and the interference signal that carries the information of the measured displacement is
According to the traditional PGC-arctan demodulation algorithm, the interference signal is multiplied by the fundamental frequency carrier
After the division and arctangent operations, the demodulated signal is described as
Accordingly, the CPD and AOIM can turn ideal orthogonal signals into non-orthogonal signals, which are unequal in amplitude and have DC bias. Therefore, periodic nonlinear errors
Subsequently, comparative simulation experiments were performed. The CPD was assumed to be from zero to
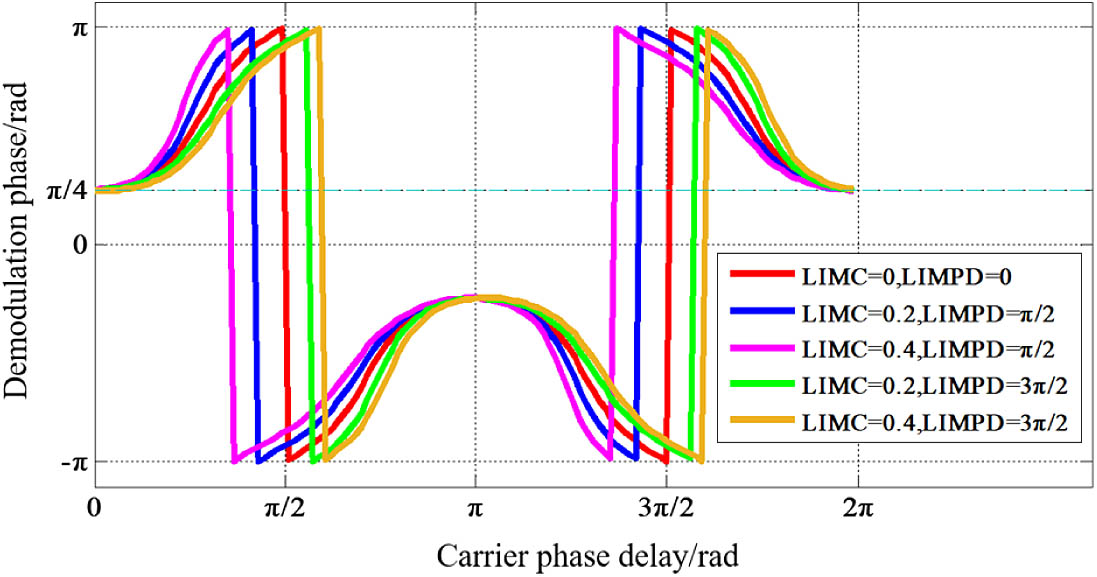
Figure 1.Effects of CPD, LIMC, and LIMPD on demodulation phase in PGC demodulation.
B. Effects of PGC PMD Deviation in Long Displacement Sensing
In the above simulation, the PMD is set to a fixed ideal value. If the effects of CPD and AOIM are ignored, the PGC-arctan demodulation scheme will work correctly when the ratio of the first and second order Bessel functions
However, when the PMD deviates from the ideal value, the demodulation results are severely affected, and nonlinear errors occur. This problem is particularly serious in the LWSM fiber-optic interferometer, as in the actual displacement sensing, it is difficult to accurately obtain the initial working distance and determine the initial PGC PMD value, which is determined by the working distance and laser wavelength modulation amplitude. Furthermore, in the process of object displacement, the working distance of the system will inevitably change, which has little impact on the displacement at the micrometer level but a significant influence on the displacement at the centimeter level; therefore, the PMD will have large deviations, making the system abnormal. Figure 2 shows the effects of the working distance and laser frequency modulation amplitude in PGC demodulation on the demodulation phase.
![]()
Figure 2.Demodulation phase on both working distance and laser frequency modulation amplitude.
As in Fig. 1, the correct phase demodulation value must be
C. Precision PGC Demodulation for Long Displacement Sensing
As mentioned above, CPD, AOIM, and PMD deviations significantly affect the accuracy of the demodulation results in PGC. Therefore, it is necessary to eliminate the associated errors. The precision PGC demodulation for long displacement sensing includes three steps: (1) calculation and elimination of CPD and LIMPD; (2) initial PMD adaptive technology under different working distances; and (3) dynamic PMD tracing and AOIM elimination for long displacement sensing. A schematic of precision PGC demodulation for long range dynamic displacement in the LWSM interferometer is shown in Fig. 3.
![]()
Figure 3.Schematic of precision PGC demodulation in LWSM interferometer. M, reflector; APD, avalanche photodetector; SMF, single mode fiber; FC, fiber-optic circulator; DDS, direct digital synthesizer; ADC, analog-to-digital converter; LPF, low-pass filter; DAC, digital-to-analog converter; DFB, distributed feedback laser; EN, enabling end of a nonlinearity correction unit; PVD, peak value detection; SAD, signal amplitude detection.
1. Calculation and Elimination of CPD and LIMPD
The objective of this part is to calculate and eliminate CPD and LIMPD. The details are given below.
Here,
Among them,
2. Initial PMD Adaption at Different Working Distances
The main task in this scheme is to control the initial static PMD of the interferometer, which is to avoid the deviation of the initial PMD from the ideal value due to the uncertain initial working distance.
However, because the PMD at this time is still not an optimal value,
In summary, by employing the above techniques, the PMD is automatically adjusted to the optimal value. Combined with the elimination of the CPD and AOIM, the nonlinear error is eliminated, and precise PGC demodulation is realized.
3. Dynamic PMD Tracing and AOIM Elimination for Long Displacement Sensing
Above, we described the technique when the object moves statically or in a very small range. However, when the object moves a few tens of centimeters, the PMD will inevitably deviate from the ideal value owing to the change in the working distance of the interferometer. Therefore, the laser wavelength modulation amplitude must be adjusted in real time to realize tracking of the ideal PMD. AOIM will change simultaneously. Thus, dynamic PMD tracing and AOIM elimination for long displacement sensing are necessary. In the movement process of the object to be measured, the real-time working distance can be calculated by subtracting the initial working distance from the displacement value of the object to be measured, after which the real-time PMD
For the elimination of dynamic AOIM, according to the experimental records, LIMC is found to change, whereas LIMPD remains unchanged, such that the relationship between LIMC and laser frequency modulation amplitude measured in advance is derived as follows:
3. EXPERIMENTAL RESULT
The experimental setup of the fiber-optic LWSM interferometer is built. The laser source was a distributed feedback (DFB) laser (DFB PRO BFY, Toptica, Germany), and the interference signal was detected by a photodetector. Interference signal processing and modulation signal generation were performed by a signal-processing board. Using the above devices, we constructed the interferometer proposed in this study. The interferometer used for comparison was SIOS. The measured nanometer displacement was provided by a nanoposition stage (P-733, Physik Instrument, Germany) with a movement range of 30 μm. The measured large range displacement was provided by a stage (A-123.750A1, Physik Instrument, Germany) with a movement range of 750 mm. The experimental setups used for interferometer tests are shown in Fig. 4.
![]()
Figure 4.Experimental setups used for interferometer tests.
A. Feasibility Verification of Proposed Method
To demonstrate the principle of the proposed method, the experimental proof was carried out.
1. Feasibility Verification of CPD and LIMPD Calculation
In this experiment, the performance of the designed signal processing was evaluated with a simulative interference signal generated by field programmable gate array (FPGA) according to Eq. (1). All simulative parameters can be set flexibly in the FPGA. To prove the effectiveness of the calculation unit of CPD and LIMPD,
Using the CPD and LIMPD calculation method described in Section 2, the AC terms
![]()
Figure 5.CPD and LIMPD calculation results: blue traces and red traces correspond to the left ordinate; yellow traces and pink traces correspond to the right ordinate.
Figure 5 shows the calculated CPD and LIMPD that are equal to
2. Feasibility Verification of PMD Adaptation for Initial Position and Dynamic Movement
In this part, according to the correlation formula in Refs. [15,16], their schemes were reproduced and compared with the method proposed in this paper. The discussion and analysis of phenomena were also carried out.
First, the initial working distance of the interferometer was set from 2.4 to 40 cm to demonstrate the effectiveness of initial PMD control. The default initial laser frequency modulation amplitude was set to
Hence, when the working distance is 5 cm, the corresponding PMD is an ideal value of 2.63. The previous research method [15] and the proposed method were used to initialize the PMD of the system under different working distances. The initial PMD results are plotted in Fig. 6(a). By comparison, the method proposed in this paper can achieve a better initial PMD setting under different working distances with an uncertainty of 0.01 rad. In the previous study, the initial PMD was set incorrectly at some working distances because the Bessel coefficient, the denominator in the calculation formula, would be zero at some working distances, and jump singularities would be generated.
![]()
Figure 6.(a) Phase modulation depth measured by two methods at different working distances. (b) PMD measured by two methods at interferometer operating point. (c) Demodulation results of two methods from 2.4 to 40 cm displacement.
Subsequently, to compare and demonstrate the dynamic control performance of PMD for micro displacement, we set two interference signal cycles of the object, and PMD was calculated and controlled by the previous research method and the one proposed in this study.
The calculated results are plotted in Fig. 6(b), and they show that the calculation and control of PMD in previous research are incorrect when the phase is
Finally, to show the control performance of PMD in a large range of motions, the object was moved from 2.4 to 40 cm, and the measured demodulation results are drawn in the Fig. 6(c). The proposed method effectively controls the PMD of displacement in a large range of motion. However, the approach yields incorrect results at some distances.
Discussion and analysis of phenomena: in Ref. [15], the combination of the first to fourth harmonics of the input signal from the optical fiber interferometer was used to obtain PMD. The proportion integral differential (PID) algorithm was used to control the PMD. The core formula is given as follows:
When
The above analysis and discussion are in good agreement with the experimental results. It proves that the method in this paper can work including all initial positions and dynamic movements and avoids the production of jump singularities.
3. Feasibility Verification of Modified PGC Proposed in This Paper
The above experiments verify the proposed method of CPD and LIMPD simultaneous calculation and PMD control method for initial position and dynamic movement of an object. Subsequently, two demodulation algorithms of PGC-CPDC–LIMC and PGC-CPDC–LIMC–PMDC composed of the above technologies were verified by experiments.
First, the CPD was set as 0°, 45°, and 90°, and the PMD was set as 3.20 and 3.83; in total, there were six combinations. Using PGC-arctan (ATAN) and the above two algorithms for signal processing, the Lissajous diagrams of the signals obtained by the two filters are drawn in Fig. 7.
![]()
Figure 7.Lissajous diagrams for three methods under different phase delays and phase modulation depths.
When PMD is 3.20, CPD is zero, and the Lissajous diagrams of PGC-ATAN and PGC-CPDC–LIMC are both elliptical. When CPD is
The classical ellipse fitting nonlinear elimination method was employed to further compare system performance. The CPD was set to 20° and 40°,
![]()
Figure 8.SINAD values for four methods under different phase delays and phase modulation depths.
In contrast, the SINADs of ellipse fitting and PGC-CPDC–LIMC–PMDC are consistently better. However, when
B. Displacement Measurement Experiment
1. Feasibility Verification of PMD Adaptation for Initial Position and Dynamic Movement
First, the small range displacement was tested and compared. The nanometer displacement stage was set to move for 3 μm, and the step was set as 5 nm. The proposed interferometer and SIOS SP-NG were used for the respective tests.
The test results of the displacement stage and the two interferometers are plotted in Fig. 9(a), and the difference between the measured results of the interferometer and the displacement stage is calculated and plotted in Fig. 9(b). The displacement offset is observed at
![]()
Figure 9.Experimental results for nanometer displacement measurement with 5 nm step size.
2. Experiment for a Large-Scale Displacement Measurement
Subsequently, a large-scale displacement test and comparison were carried out. The Physik Instrumente (PI) displacement stage is set to move 400 mm, and the interferometer proposed in this paper and SIOS SP-NG are used for the respective tests.
The test results of the two interferometers and the offset with the displacement stage are plotted in Fig. 10(a). The offsets are found to be similar, which may be caused by the accuracy of the displacement stage. The difference between the measured values of two interferometers is plotted in Fig. 10(b). The displacement difference ranges between
![]()
Figure 10.Comparison experiment of large range displacement measurements.
3. Resolution and Stability of Proposed Interferometer
Next, the resolution of the proposed interferometer was tested, and the nanometer displacement stage parameters were set to a round-trip step of 0.4 nm and a step time of 1 s.
Figure 11(a) shows that there is an obvious round-trip step that can be distinguished; however, because the noise of the displacement stage is superimposed on the signal, better measurement results can be obtained with a more accurate displacement stage. Hence, the resolution of the interferometer proposed in this study is below 0.4 nm.
![]()
Figure 11.Experimental results of displacement measurement resolution of proposed interferometer and its long-term stability.
The stability test platform is made of high-stability material, and the object to be tested is cured by UV glue. The system stability was measured for 1 h. The results are plotted in Fig. 11(b). The drift within 1 h is below 2.5 nm, and the short-term stability in 1 min is below 0.4 nm. Therefore, according to the experimental results, an interferometer with sub-nanometer resolution and nanometer precision can be realized.
4. CONCLUSION
A fiber laser interferometer with sub-nanometer resolution is proposed for use in large-scale measurements. An optimized PGC algorithm is employed in the interferometer. First, a method is proposed to simultaneously calculate CPD and LIMPD, to compensate for and eliminate the influence of CPD and AOIM. Unlike other studies on the elimination of CPD, AOIM is added to the model, which increased the accuracy of demodulation. Second, we propose a method to control the PMD by combining frequency sweeping interference and modified PGC-arctan demodulation to measure the real-time working distance. Through comparative experiments, the advantages of this method are demonstrated. It can be used for large-scale displacement measurement, and it simultaneously avoids the production of jump singularities with movement as observed with other methods. Therefore, it improves the practicability and demodulation accuracy of the system. Displacement experiments show that the proposed interferometer achieves large range displacement measurements and sub-nanometer measurement accuracy. In future studies, we plan to correct the idle zone error of the interferometer by combining the obtained initial working distance with the refractive index testing instrument.
Acknowledgment
Acknowledgment. Y. D. thanks the National Natural Science Foundation for supporting this work.
References
[1] S. Yin, P. B. Ruffin, F. T. S. Yu. Fiber Optic Sensors(2008).
[2] E. Udd, W. B. Spillman. Fiber Optic Sensors: An Introduction for Engineers and Scientists(2011).
[3] J. Song, W. Li, P. Lu, Y. Xu, L. Chen, X. Bao. Long-range high spatial resolution distributed temperature and strain sensing based on optical frequency-domain reflectometry. IEEE Photon. J., 6, 6801408(2014).
[4] D. P. Zhou, Z. Qin, W. Li, L. Chen, X. Bao. Distributed vibration sensing with time-resolved optical frequency-domain reflectometry. Opt. Express, 20, 13138-13145(2012).
[5] Y. Dong, P. Hu, M. Ran, H. Fu, H. Yang, R. Yang. Correction of nonlinear errors from PGC carrier phase delay and AOIM in fiber-optic interferometers for nanoscale displacement measurement. Opt. Express, 23, 18997-19009(2020).
[6] X. Zhou, Q. Yu. Wide-range displacement sensor based on fiber-optic Fabry–Perot interferometer for subnanometer measurement. IEEE Sens. J., 11, 1602-1606(2011).
[7] Q. Wang, Z. Ma. Feedback-stabilized interrogation technique for optical Fabry–Perot acoustic sensor using a tunable fiber laser. Opt. Laser Technol., 51, 43-46(2013).
[8] X. Mao, X. Zhou, Q. Yu. Stabilizing operation point technique based on the tunable distributed feedback laser for interferometric sensors. Opt. Commun., 361, 17-20(2016).
[9] A. Dandridge, A. B. Tveten, T. G. Giallorenzi. Homodyne demodulation scheme for fiber optic sensors using phase generated carrier. IEEE J. Quantum Electron., 18, 1647-1653(1982).
[10] T. R. Christian, P. A. Frank, B. H. Houston. Real-time analog and digital demodulator for interferometric fiber optic sensors. Proc. SPIE, 2191, 324-336(1994).
[11] S. Zhang, L. Yan, B. Chen, Z. Xu, J. Xie. Real-time phase delay compensation of PGC demodulation in sinusoidal phase-modulation interferometer for nanometer displacement measurement. Opt. Express, 25, 472-485(2017).
[12] A. N. Nikitenko, M. Y. Plotnikov, A. V. Volkov, M. V. Mekhrengin, A. Y. Kireenkov. PGC-ATAN demodulation scheme with the carrier phase delay compensation for fiber-optic interferometric sensors. IEEE Sens. J., 18, 1992-1995(2018).
[13] K. Wang, M. Zhang, F. Duan, S. Xie, Y. Liao. Measurement of the phase shift between intensity and frequency modulations within DFB-LD and its influences on PGC demodulation in a fiber-optic sensor system. Appl. Opt., 52, 7194-7199(2013).
[14] Y. Dong, P. Hu, Z. Le, H. Fu, H. Yang, R. Yang. Phase modulation depth setting technique of a phase-generated-carrier under AOIM in fiber-optic interferometer with laser frequency modulation. Opt. Express, 28, 31700-31713(2020).
[15] A. V. Volkov, M. Y. Plotnikov, M. V. Mekhrengin, G. P. Miroshnichenko, A. S. Aleynik. Phase modulation depth evaluation and correction technique for the PGC demodulation scheme in fiber-optic interferometric sensors. IEEE Sens. J., 17, 4143-4150(2017).
[16] J. Xie, L. Yan, B. Chen, Y. Lou. Extraction of carrier phase delay for nonlinear errors compensation of PGC demodulation in an SPM interferometer. J. Lightwave Technol., 37, 4143-4150(2019).
[17] L. Yan, Y. Zhang, J. Xie, Y. Lou, B. Chen, S. Zhang, Y. Zhou. Nonlinear error compensation of PGC demodulation with the calculation of carrier phase delay and phase modulation depth. J. Lightwave Technol., 39, 2327-2335(2021).
[18] P. L. M. Heydemann. Determination and correction of quadrature fringe measurement errors in interferometers. Appl. Opt., 20, 3382-3384(1981).
[19] L. Yan, Z. Chen, J. Xie, E. Zhang. Precision PGC demodulation for homodyne interferometer modulated with a combined sinusoidal and triangular signal. Opt. Express, 26, 4818-4831(2018).


Set citation alerts for the article
Please enter your email address

© Copyright 2018-2021 | Chinese Laser Press. All Rights Reserved 沪ICP备15018463号-20