
Jianpeng Ao, Jing Huang, Minbiao Ji. Stimulated Raman Scattering Microscopy and Its Applications[J]. Laser & Optoelectronics Progress, 2022, 59(4): 0400001
- Laser & Optoelectronics Progress
- Vol. 59, Issue 4, 0400001 (2022)
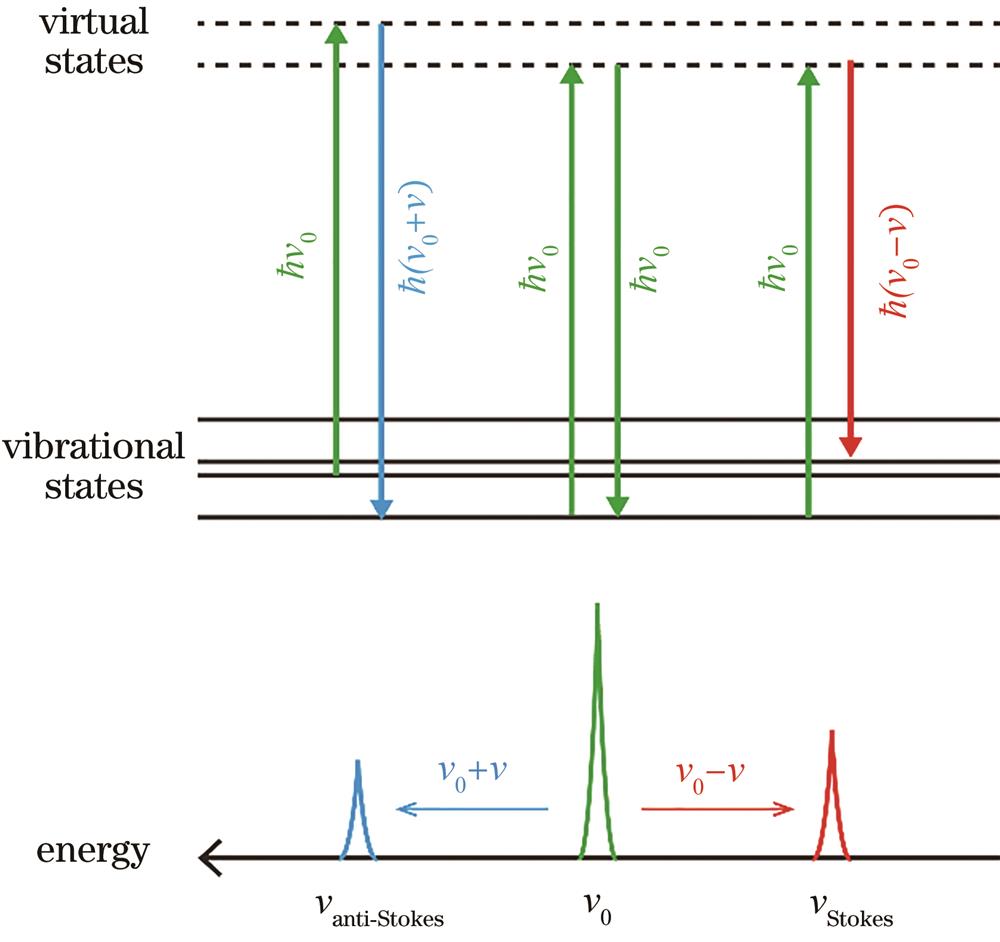
Fig. 1. Schematic of Raman scattering energy level
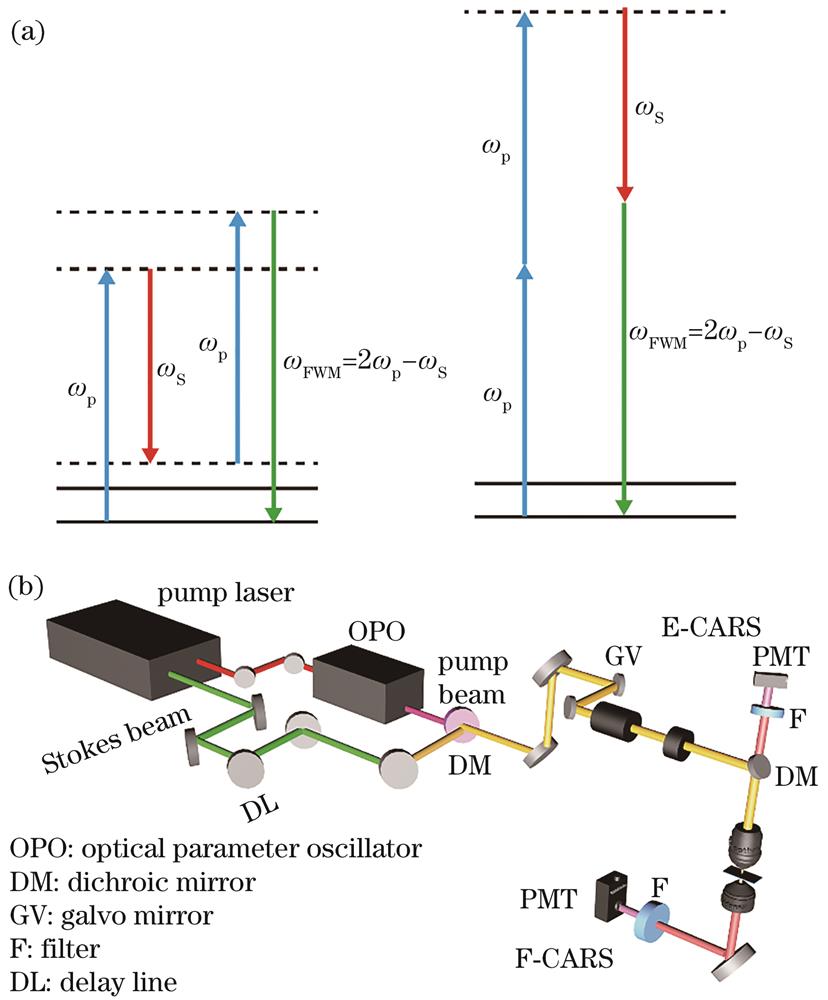
Fig. 2. Schematic of CARS microscopy. (a) Diagram of the FWM processes that contributes to the non-resonant background; (b) setup of the CARS system
Fig. 3. Principle, composition, and characteristics of SRS microscopy. (a) Energy diagram of SRS; (b) energy transfer process of SRS; (c) typic spectrum of SRS and CARS; (d) setup of SRS system and modulation transfer scheme; (e) relationship between the SRS signal of sulfate ion and the concentration
Fig. 4. Development of SRS in imaging speed, detection sensitivity, and resolution. (a) Improved back detection method[34]; (b) dual-phase SRS detecting lipid and protein channels simultaneously[42]; (c) detection sensitivity of pre-resonance stimulated Raman scattering[30]; (d) energy level diagram of the SREF and the single-molecule image of Rhodamine 800[49]; (e) plasma-enhanced SRS (PESRS) achieving single-molecule sensitivity, schematic of plasma enhancement of adenine on gold nanostructures[50]; (f) high-resolution imaging of HeLa cells[51]; (g) reversible switchable SRS imaging, selectively light/erase HeLa cells by irradiating UV/visible light[60], scale bar is 20 μm
Fig. 5. Representative works of SRS in cell biology. (a) Time-lapse label-free imaging of DNA in a HeLa cell undergoing cell division by using SRS[63]; (b) two-color pulse-chase imaging of newly synthesized proteins achieved by sequential labeling of group II and group I d-amino acids[65], scale bar is 10 μm; (c) SRS imaging of deuterated fatty acids[28], scale bar is 10 μm
Fig. 6. Representative works of SRS in tissue biology. (a) Naked eye and SRS observation pictures of the same tumor infiltration area and SRS imaging of intact mouse brain slices[17], scale bar is 500 μm; (b) SRS pictures of various parts of tissue, scale bar is 50 μm; (c) brain-tumor interface delineated by using CNN semantic segmentation[76]; (d) hyperspectral SRS combining spectrum information and image information to analysis different chemical components in liver tissue[15], scale bar is 30 μm; (e) SRS images and spectra of MSU (green), DCCP (blue), and tissue (gray) in synovial tissue[79], scale bar is 20 μm; (f) SRS spectra of benign calcification and malignant calcification and fitting of its five-group decomposition spectra[81]
Fig. 7. Representative works of SRS in neurobiology. (a) SRS imaging of neuromuscular junction of frog skin and pectoral muscle after electrical stimulation[14]; (b) single action potential can be captured by label-free SRS imaging on a patched neuron[83], scale bar is 20 μm; (c) long-term in vivo imaging of peripheral nerve degeneration in ALS mouse models by SRS model[18], scale bar is 10 μm; (d) SRS detection of Aβ misfolded protein, SRS imaging of brain slices in Alzheimer's mouse model[11], scale is 30 μm; (e) fluorescence (green) and correlative SRS images of mHtt-97Q-GFP aggregates (white arrow) at 2167 cm-1, 2035 cm-1, and 2940 cm-1 in live cells after 100 nmol/L geldanamycin treatment for 20 h[84], scale bar is 10 μm
Fig. 8. Representative works of SRS in microbiology, pharmacology, and materials science. (a) Label-free video-rate SRS imaging of heterogeneous distribution of metabolites[85], scale bar is 10 μm; (b) time-lapse SRS imaging of P. aeruginosa after culture in D2O containing medium[87]; (c) SRS imaging of tyrosine kinase inhibitors[91]; (d) schematic illustration of a Li-Li symmetric cell under SRS imaging[95]; (e) SRS imaging of h-BN[96]; (f) 3D profiling of atmospheric aerosols shows that the spatial composition of SO42-,NO3- inorganic salts is very different[97], scale bar is 1 μm; (g) visual tracking of acrylamide polymerization process by SRS and kinetic curve of polymerization rate[98], scale bar is 5 µm

Set citation alerts for the article
Please enter your email address
© Copyright 2018-2021 | Chinese Laser Press. All Rights Reserved 沪ICP备15018463号-20