
Yuting Su, Hongwei Gai. Single Molecule Counting Immunoassay[J]. Laser & Optoelectronics Progress, 2022, 59(6): 0617011
- Laser & Optoelectronics Progress
- Vol. 59, Issue 6, 0617011 (2022)
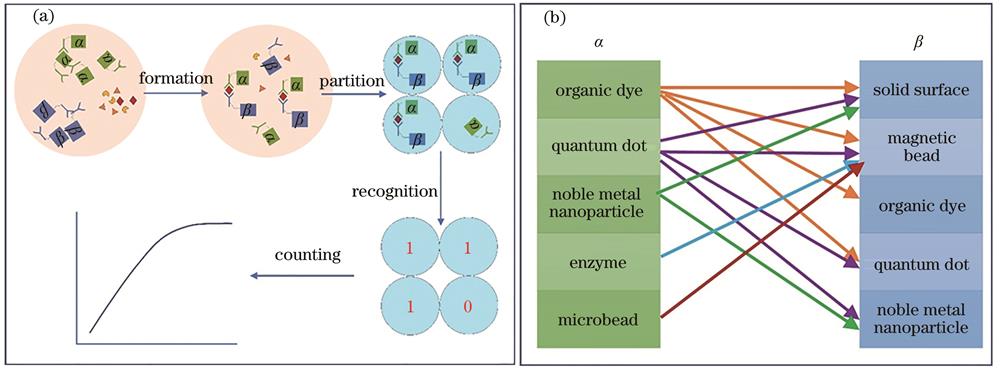
Fig. 1. Digital immunoassay. (a) General flow; (b) classification and combination of coupled markers
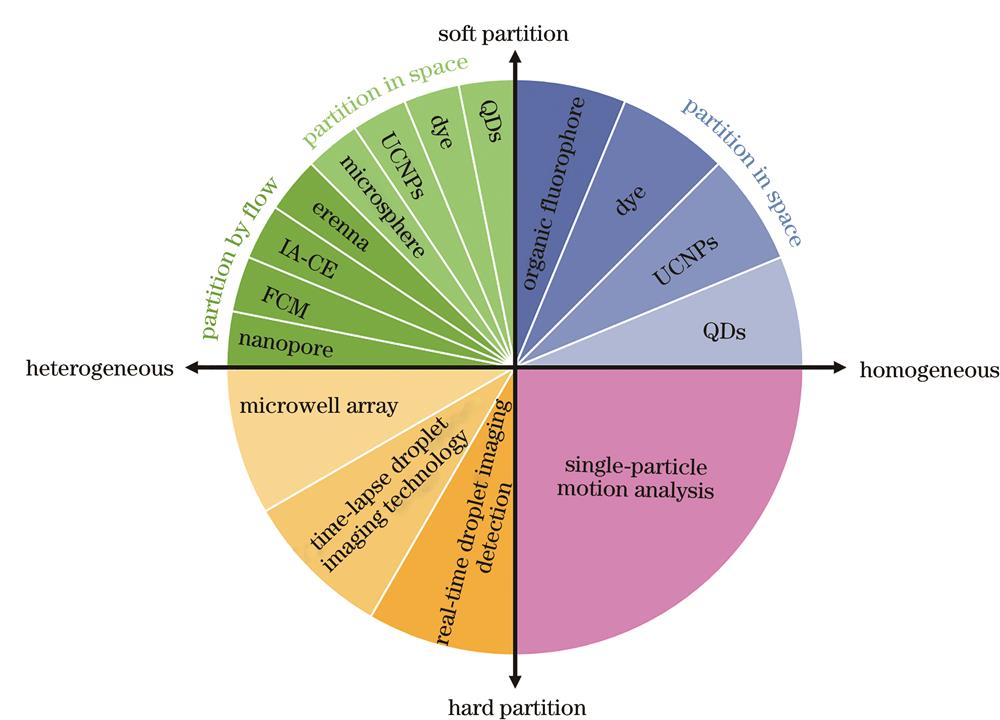
Fig. 2. Schematic diagram of classification methods of single molecule counting immunoassay
Fig. 3. Schematic diagram of counting molecules in spatial discrete mode.(a) Schematic diagram of glass bead amplified single quantum dot imaging setting; (b) eluted particles are dispersed on the slide for grid imaging counting; (c) scheme of upconversion microscopy and schematic diagram of immunoassay[29,33-34]
Fig. 4. Tyramide radicals are deposited on beads labeled with HRP, and beads are counted digitally by FCM[22]
Fig. 5. Schematic procedure and typical electropherogram of online sandwich immunoassay of IgE coupled with CE/LIF detection[43]
Fig. 6. Schematic illustration of digital immunoassay workflow with nanopore electrical detection. (a)~(c) Paramagnetic beads (PMBs) conjugated with antibodies efficiently capture specific target protein in serum sample and incubate with secondary antibody; (d) immuno-sandwich structure is incubated with biotinylated ssDNA junction strand; (e) following another wash, solution is exposed to UV light to release junction strand; (f) pipette recovers the supernatant containing connecting chain; (g) dumbbell-like DNA nanostructure is assembled; (h) digital nanopore sense used to determine fraction of probes to dumbbells[31]
Fig. 7. Schematic diagram of protein multiple detection method based on single molecule counting.(a) Composite is loaded into array and sealed with oil; (b) scanning imaging of bead fluorescence; (c) scanning imaging of enzyme catalyzed fluorescence[19]
Fig. 8. Protein detection method based on digital ELISA and droplet microfluidic counting.(a) Bead-based sandwich immunoassay, antibody coated paramagnetic beads bind to target protein molecules, and then biotinylated detection antibody and SβG binds to target protein molecules to form enzyme labeled immune complexes; (b) complexes are divided into droplets. According to Poisson statistics, most droplets will have no immunocomplex, while some droplets will have only one immunocomplex; (c) droplets are loaded into chamber to form a droplet array and imaged[52]
Fig. 9. Schematic diagram of particle counting system and T-shaped droplet chip.(a) Schematic diagram of digital single particle counting system based on droplet; (b) schematic diagram of chip with T-shaped connection channel and droplet splitting process[54]
Fig. 10. Schematic diagram of parallel microfluidic droplet generator and real-time detection process.(a) Top view and bottom view of µMD chip, which shows process of droplet generation and incubation on µMD; (b) pocess that individual beads are encapsulated into droplets and read out if they have captured a single target protein[55]
Fig. 11. Single molecule immunoassay based on properties of quantum dots.(a) Schematic diagram of two-color spatial "overlay-based" homogenous immunoassay; (b)~(c) a single quantum dot that does not form an immunecomplex shows itself in red or green when amplified, and a conjugated quantum dot shows itself in yellow; (d) schematic diagram of aggregation immunoassay with the same kind of quantum dots as labels; (e) typical spectral blue shifts of single quantum dots; (f) typical spectral blue shifts of aggregated quantum dots[23,24]
Fig. 12. Schematic diagram of kinetic fingerprint and comparison of detection limits between SiMREPS and ELISA. (a) Bright puncta at locations where single fluorescent probes are bound at or near the imaging surface, and representative kinetic fingerprints show repeated binding to the same antigen molecule (top) and nonspecific binding, usually with less repeatability (bottom); (b)~(e) quantification of four protein targets using single molecule kinetic fingerprints. LODs yielded by sandwich ELISA assays are 55- to 383-fold higher than those of corresponding SiMREPS[30]
Fig. 13. Schematic illustration of multiplexed digital Ho-Non ELISA for detection of two types of biomarkers. (a) Target molecules are respectively captured by each subpopulation of antibody-coated magnetic nanobeads; (b) beads are pulled into reactors by magnetic force (orange arrow), followed by injection of oil to seal reactors; (c) target molecules on beads reacted with each antibody modified to reactor surface; (d) fluorescence images are obtained at 10 ms time; (e) bead motions are classified into three patterns and tethered particles are counted digitally as target-positive beads[26]
Fig. 14. Single molecule analysis determines isozymes of ALP[64]
Fig. 15. Correlations of measured amyloid-β1-42 peptide (Aβ1-42) concentrations in clinical samples (a),(b) when using two different Aβ1-42 assays (methods used in literatures or Quanterix commercial kit assay) for sample analysis and (c),(d) when using two different Aβ1–42 peptide standards (Quanterix or Fujirebio) for calibration[72]
Fig. 16. Workflow of gradient based digital immunoassay[83]

Set citation alerts for the article
Please enter your email address
© Copyright 2018-2021 | Chinese Laser Press. All Rights Reserved 沪ICP备15018463号-20