
Tao Wang, Jian Zhang, Na Zhang, Baiyi Wu, Siyuan Wang, Zhitai Jia, Xutang Tao. Research Progress in Preparation of Single Crystal Fiber and Fiber Lasers[J]. Laser & Optoelectronics Progress, 2019, 56(17): 170611
- Laser & Optoelectronics Progress
- Vol. 56, Issue 17, 170611 (2019)
![Schematic diagram of μ-PD system with internal inductive RF heating[18]](/richHtml/lop/2019/56/17/170611/img_1.jpg)
Fig. 1. Schematic diagram of μ-PD system with internal inductive RF heating[18]
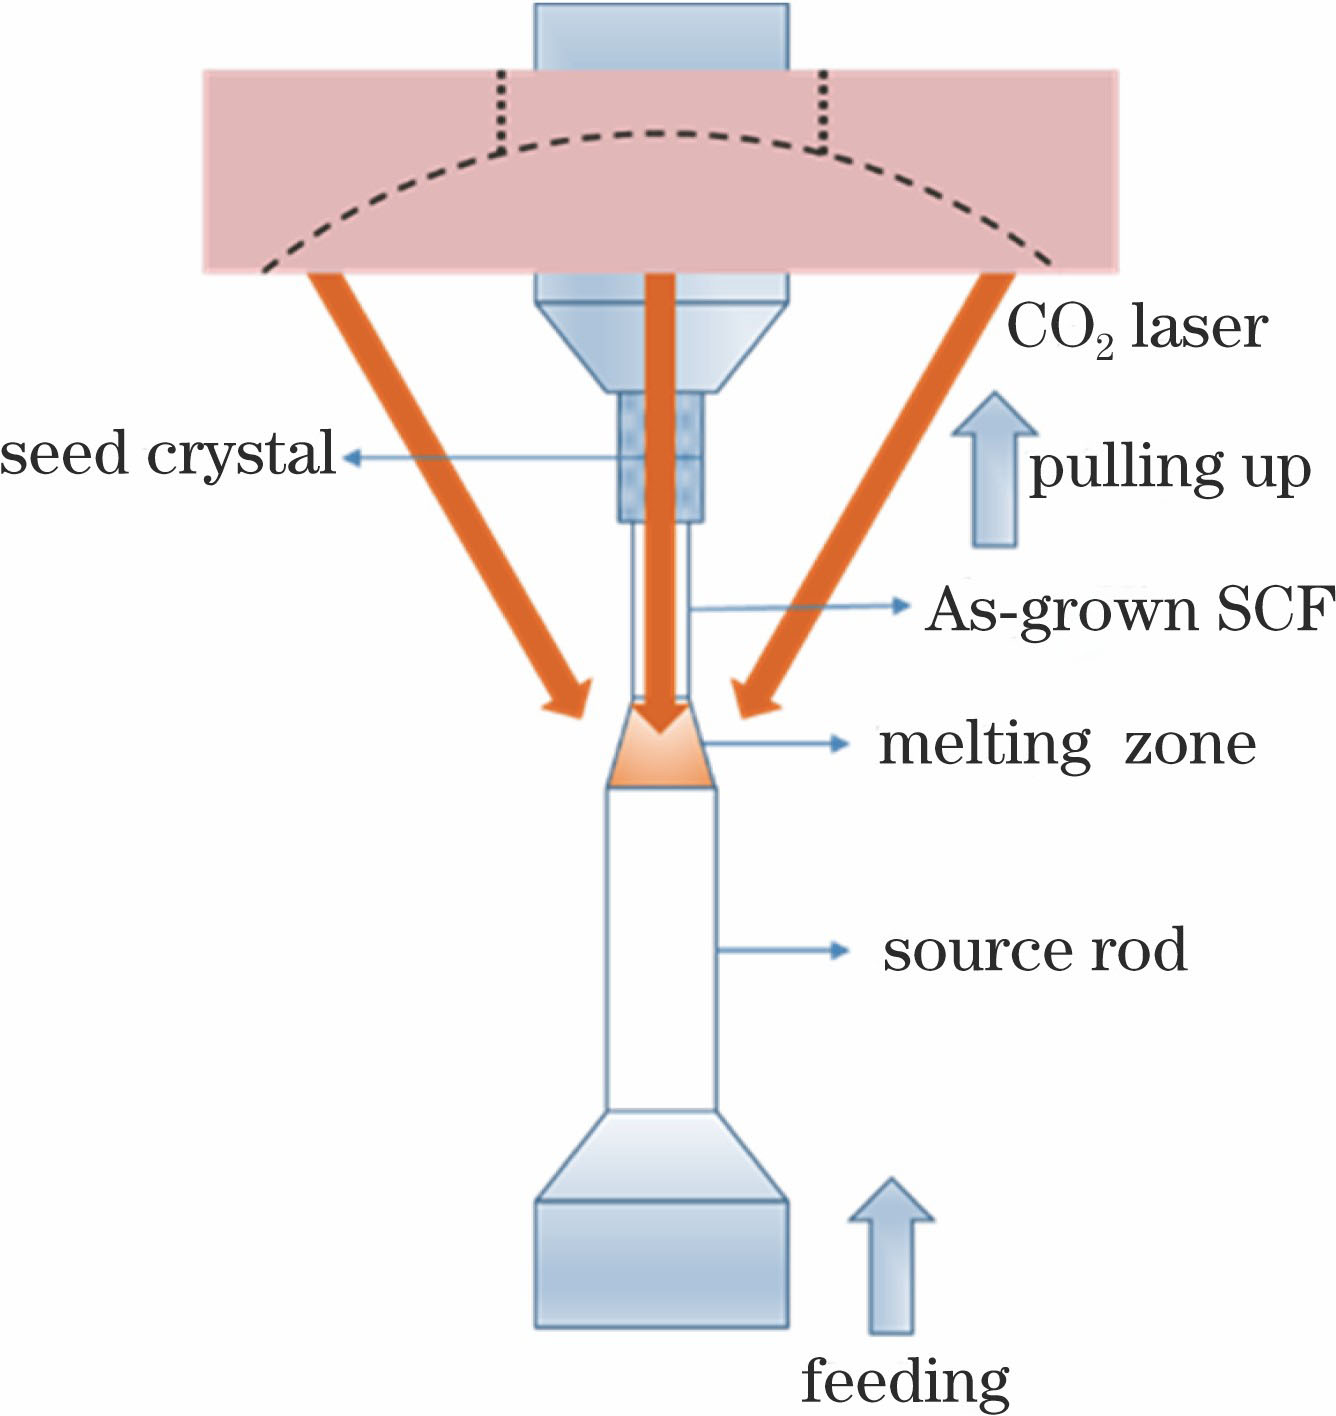
Fig. 2. Schematic of LHPG method
Fig. 3. Diameter feedback control system of LHPG[6]. (a) Schematic of the system; (b) deviation vs length
Fig. 4. NRL single crystal fiber[19]. (a) LHPG growth system; (b-c) LHPG growth of 17 μm diameter Yb∶YAG fiber; (d) 4 mm bend radius of 35 μm Ho∶YAG fiber
Fig. 5. Crystal fiber growth equipment in Shandong University. (a) LHPG equipment; (b) μ-PD equipment
Fig. 6. Single crystal fiber prepared by Shandong University
Fig. 7. Fiber diameter fluctuation. (a) Laser micrometer; (b) diameter fluctuation of YAG SCFs with different diameters
Fig. 8. Laue diffraction patterns of YAG single crystal fiber
Fig. 9. Optical uniformity. (a) Schematic of the measurement; (b) beam quality of the source; (c) beam quality after passing through the fiber
Fig. 10. Fiber loss detection[23]. 532 nm laser transmission through (a) 35 μm diameter YAG single crystal fiber; (b) thermal image from the 90 μm diameter YAG crystal fiber
Fig. 11. Micromachining of SCF[23]. (a) Optical microscope image of the single crystal fiber ends; (b-d) surface morphology of SCF measured by scanning electron microscopy(SEM); (e) confocal microscope surface topographic image of the fiber end showing excellent polishing quality; (f) SEM surface topographic image of the fiber end showing excellent quality
Fig. 12. Micrograph of the splice between the silica and YAG fiber[25]
Fig. 13. Preparation of claddings by magnetron sputtering. (a) Setup of magnetron sputtering; (b) sputter-clad fiber illuminated with a He-Ne laser[26]
Fig. 14. Schematic of the coating method[27]
Fig. 15. Comparison of mode field pattern and cross section[27]. (a) Calculated 800 nm mode-field pattern; (b) SEM image of the cross-section
Fig. 16. Preparation of claddings by LPE method[28]. (a) Simplified sketch of an LPE growth system for growing crystalline claddings; (b) corresponding cross-section optical transmission image of Yb∶YAG/YAG fibers
Fig. 17. Schematic of CDLHPG system[29]
Fig. 18. Schematic of “Transitional” fiber laser[30]
Fig. 19. Schematic of “C4” fiber laser[28]
Fig. 20. Schematic of Yb∶YAG fiber laser[31]
Fig. 21. Output power versus pump power of Yb∶YAG SCF[31]
Fig. 22. Optical damage experiment of Nd∶YAG single crystal fiber[6]
Fig. 23. Schematic of the “Melt-in-Tube” fiber drawing method[33]
Fig. 24. 1064 nm laser output[34]. (a) At different reflections of output mirror; (b) at different cavity lengths
|
Table 1. Comparison of performance between YAG SCF and silica fiber

Set citation alerts for the article
Please enter your email address
© Copyright 2018-2021 | Chinese Laser Press. All Rights Reserved 沪ICP备15018463号-20