• Spectroscopy and Spectral Analysis
  • Vol. 40, Issue 11, 3537 (2020)
Qiu-ling ZHAO1、1、*, Ya-jing SHI1、1, and Zhen-yu ZHANG1、1
Author Affiliations
  • 1[in Chinese]
  • 11. College of Biomedical and Chemical Engineering, Liaoning Institute of Science and Technology, Benxi 117004, China
  • show less
    DOI: 10.3964/j.issn.1000-0593(2020)11-3537-05 Cite this Article
    Qiu-ling ZHAO, Ya-jing SHI, Zhen-yu ZHANG. Rapid Determination of Canthaxanthin in Egg Yolk by First Order Derivative Spectroscopy[J]. Spectroscopy and Spectral Analysis, 2020, 40(11): 3537 Copy Citation Text show less
    Ultraviolet-visible absorption spectra of the yolk extract and canthaxanthina, b, c are the first, second and third yolk extracts respectively; d, e and f are the standard solution of canthaxanthin with concentrations of 1, 10 and 20 μg·mL-1, respectively
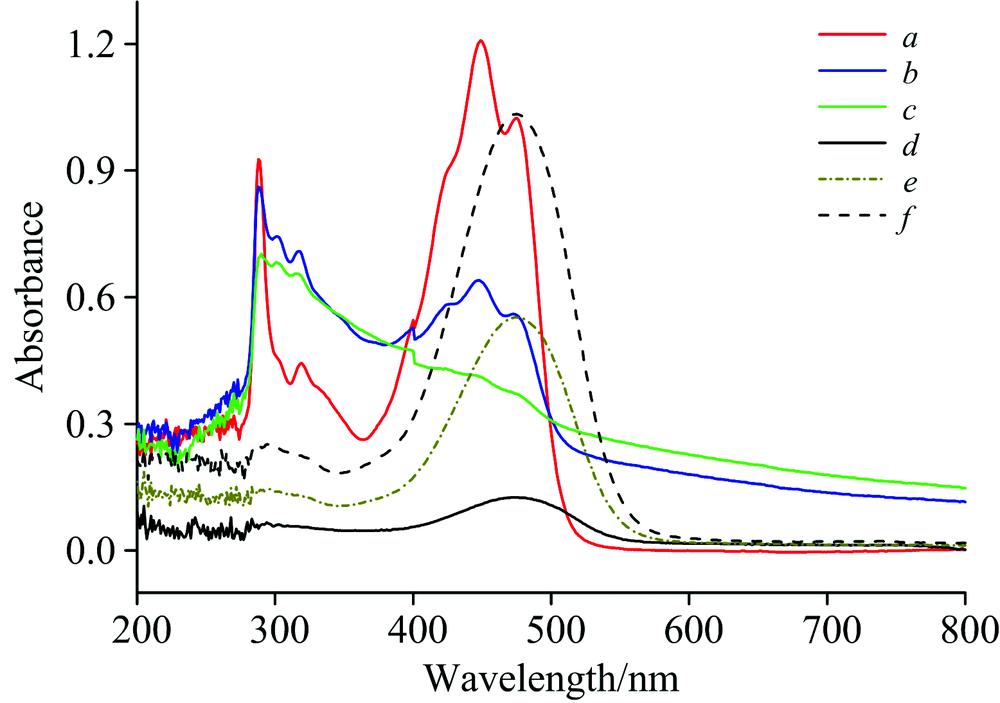
    Fig. 1. Ultraviolet-visible absorption spectra of the yolk extract and canthaxanthin
    a, b, c are the first, second and third yolk extracts respectively; d, e and f are the standard solution of canthaxanthin with concentrations of 1, 10 and 20 μg·mL-1, respectively
    The first derivative spectra of yolk extract and canthaxanthina, b, c are the first, second and third yolk extracts respectively; d, e and f are the standard solution of canthaxanthin with concentrations of 1, 10 and 20 μg·mL-1, respectively
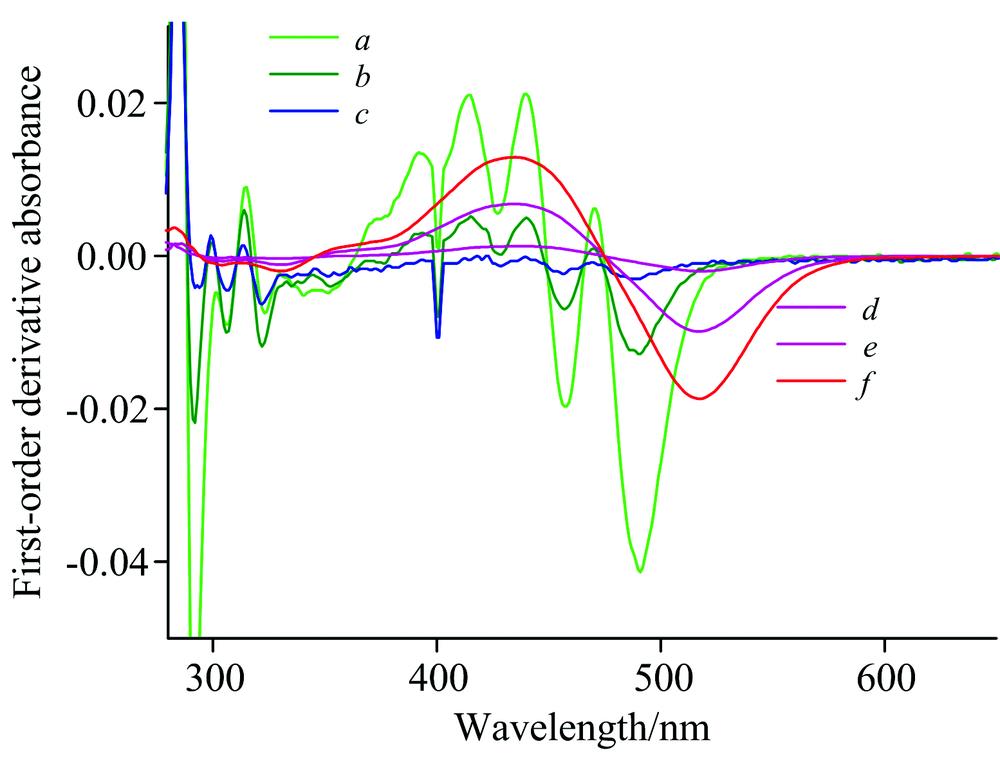
    Fig. 2. The first derivative spectra of yolk extract and canthaxanthin
    a, b, c are the first, second and third yolk extracts respectively; d, e and f are the standard solution of canthaxanthin with concentrations of 1, 10 and 20 μg·mL-1, respectively
    (a) is the ultraviolet-visible absorption spectrum of the yolk extract with canthaxanthin; (b) is the first order derivative spectrum of (a)g, h, i, j, k, l and m represent canthaxanthin with the concentrations of 0, 2.67, 5.33, 8.00, 10.67, 13.10 and 17.68μg·mL-1, respectively
    Fig. 3. (a) is the ultraviolet-visible absorption spectrum of the yolk extract with canthaxanthin; (b) is the first order derivative spectrum of (a)
    g, h, i, j, k, l and m represent canthaxanthin with the concentrations of 0, 2.67, 5.33, 8.00, 10.67, 13.10 and 17.68μg·mL-1, respectively
    Standard curve (a) and linear regression equation of canthaxanthin (b) in egg yolk extract
    Fig. 4. Standard curve (a) and linear regression equation of canthaxanthin (b) in egg yolk extract
    序号添加量
    /μg
    平均回收量
    /μg
    平均回收率
    /%
    RSD
    /%
    1.0000.97597.55.42
    样本13.0003.084102.84.69
    5.0005.079101.63.38
    1.0000.99499.45.67
    样本23.0002.94698.25.01
    5.0005.114102.32.97
    1.0001.013101.34.88
    样本33.0002.89296.44.04
    5.0004.85197.02.53
    Table 1. Standard-added recovery experiments of the samples (n=5)
    Qiu-ling ZHAO, Ya-jing SHI, Zhen-yu ZHANG. Rapid Determination of Canthaxanthin in Egg Yolk by First Order Derivative Spectroscopy[J]. Spectroscopy and Spectral Analysis, 2020, 40(11): 3537
    Download Citation