
hai LIN, Weitao SU, Yu ZHU, Pai PENG, Miao FENG, Yan YU. Lattice Control of WO3 Nanoflowers by Heat Treatment and Construction of WO3/CdS/α-S Heterojuntion [J]. Journal of Inorganic Materials, 2020, 35(12): 1349
- Journal of Inorganic Materials
- Vol. 35, Issue 12, 1349 (2020)
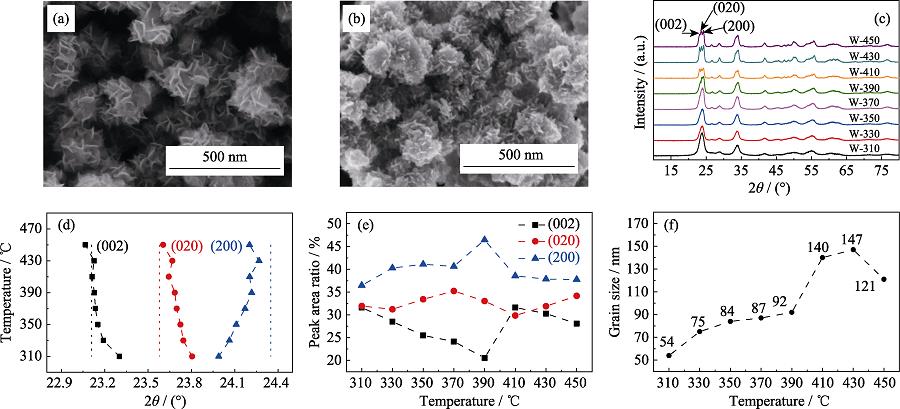
1. SEM images of WO3 nanoflower precursor (a) and W-350 (b); XRD patterns of the samples heat-treated at different temperatures (c); (002), (020), and (200) crystal plane diffraction peak positions (d), diffraction peak integrated area ratios (e) and grain sizes (f) obtained by Rietveld refinement varied as functions of heat treatment temperature
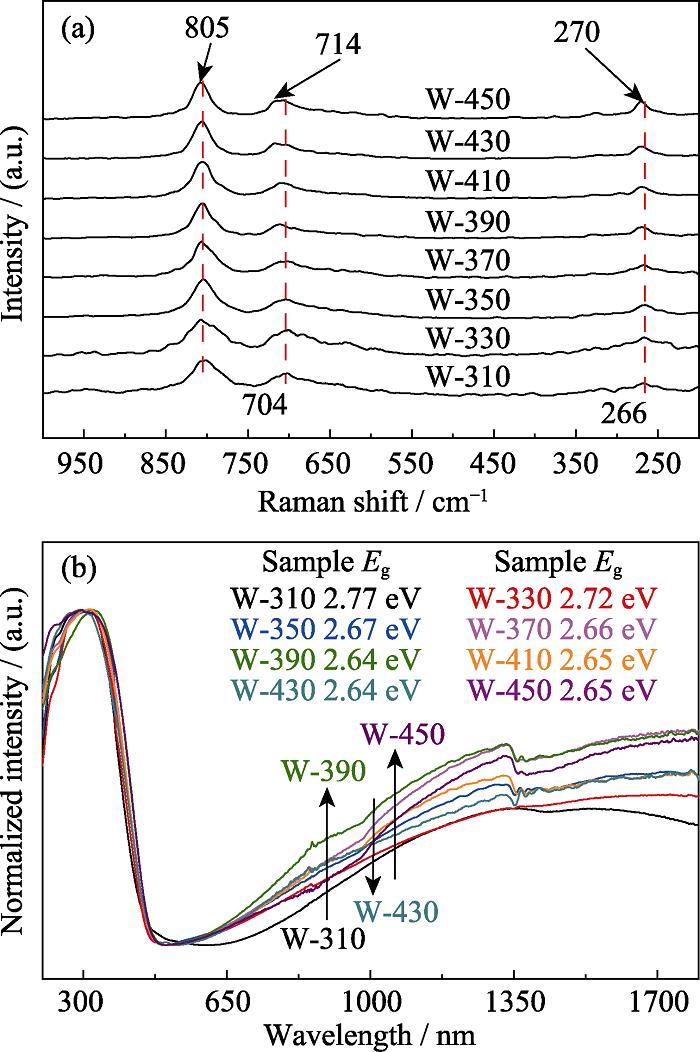
2. Raman spectra (a) and UV-Vis-IR absorption spectra (b) of the samples heat-treated at different temperatures
3. Photocurrent response curves (a), photocurrent response peak values (b) and IPCE plots (c) of the samples heat-treated at different temperatures; Mott-Schottky curve of W-350 (d) Colourful version is available on offical website
4. SEM image of W-350-30C (a); XRD patterns of W-350 and W-350-30C(b); TEM images of W-350-30C (c) and W-350-30C (d)
5. XPS spectrum of sample W-350-30C (a); XPS high-resolution spectra of W4f (b), O1s (c), Cd3d (d) and S2p (e) for sample W- 350-30C; UV-Vis-IR absorption spectra (f) and photos (g) of γ -WO3 nanoflowers with different amounts of CdS/α -S modified on the surface Colourful version is available on offical website
6. Photocurrent response curves(a), photocurrent response peak values(b), and IPCE plots(c) of γ -WO3 nanoflowers modified with different amounts of CdS/α-S on the surface; EIS plots of W-350 and W-350-30C(d) Colourful version is available on offical website
7. Schematic diagram of charge carriers transfer in γ -WO3 nanoflowers with CdS/α -S modified on the surface
S1. SEM images of precursor (a), W-310 (b), W-330 (c), W-370 (d), W-390 (e), W-410 (f), W-430 (g), and W-450 (h).
S2. Rietveld refinement results of XRD data from W-310 (a), W-330 (b), W-350 (c), W-370 (d), W-390 (e), W-410 (f), W-430 (g), W-450 (h)
S3. Tauc plots of W-310 (a), W-330 (b), W-350 (c), W-370 (d), W-390 (e), W-410 (f), W-430 (g), W-450 (h) and the band gaps E g obtained from the intersection of the absorption edge intercept line
S4. Raman spectra of WO3 precursor and representative heat-treated samples (a) and the WO3 sample heat-treated above 350 ℃ (b)
S5. FT-IR spectra of WO3 precursor and heat-treated samples
S6. EDX results of W-350-10C
S7. UV-Vis spectra of methylene blue solution after absorbed by W-350 in the dark and UV irradiation for different time (a); Variation of methylene blue degradation rate with different time (b)
|
Table 1. Rietveld refinement results of XRD data of the samples heat-treated at different temperatures


Set citation alerts for the article
Please enter your email address

© Copyright 2018-2021 | Chinese Laser Press. All Rights Reserved 沪ICP备15018463号-20