
Hai-Tao ZHENG, Shi-Yong LI, James DO., Hou-Jun SUN, Xiao-Guang LIU. Extended Omega-k algorithm for synthetic aperture radar imaging in multi-layer medium[J]. Journal of Infrared and Millimeter Waves, 2020, 39(3): 381
- Journal of Infrared and Millimeter Waves
- Vol. 39, Issue 3, 381 (2020)
Abstract
Introduction
Synthetic aperture radar (SAR) processing techniques are commonly used in radar, sonar, seismic and ultrasound imaging[
Among SAR processing techniques, the migration is a family of effective algorithms originated from seismic imaging[
The use of migration algorithms for GPR imaging has become popular in recent years due to the high computational efficiency of the fast Fourier transform (FFT) which enables low execution time at the cost of increased memory usage[
In this paper, we extend the original Omega-k algorithm to the multi-layer medium scenario, at the same time, reserving its high computational efficiency. For multi-layer geometry in which layers of homogeneous media are stacked vertically, PSM is first applied recursively to each layer boundary, and then, Omega-k is used within the layer. The algorithm exploits fast Omega-k interpolation in the spatial wave-number domain instead of iterative calculating and can be implemented for multi-layer medium imaging with known each layer depth and permittivity. For multi-layer imaging, the wave velocity estimation is necessary and need to be implemented first for lateral image reconstructions. For the standoff GPRs, methods like Hough Transform or template matching[
The remainder of this paper is organized as follows: The extended Omega-k (EWK) algorithm for multi-layer medium is introduced in Sect. 1. Section 2 introduces the data validation platform and presents the velocity estimation result. In Sect. 3, various experimental imaging results for buried metallic targets in sand is presented. The conclusion is given in Sect. 4.
1 Theory of proposed algorithm for multi-layer medium
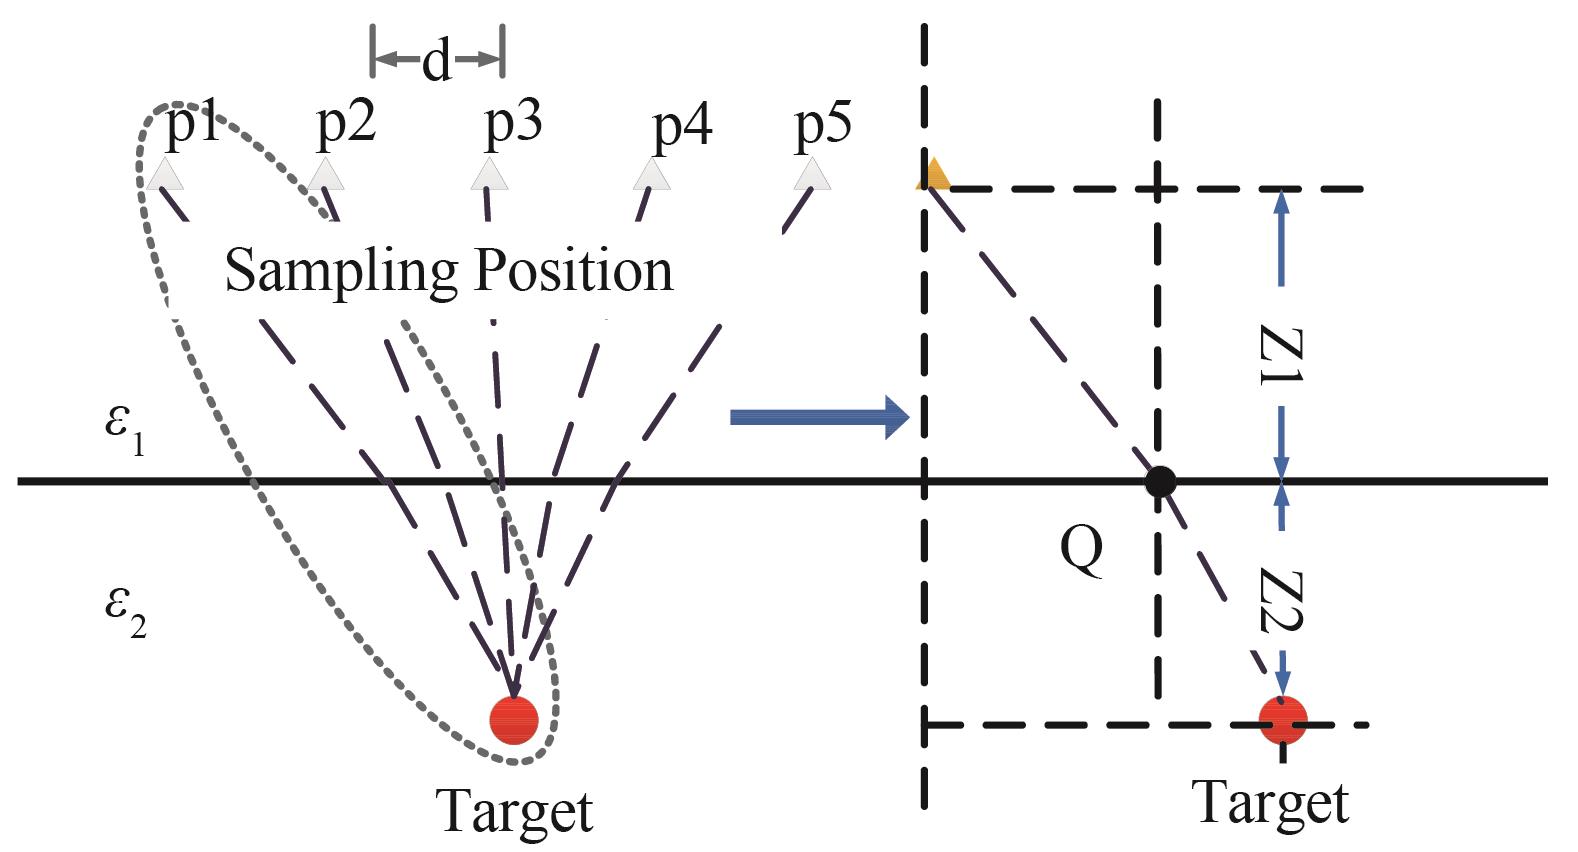
Considering the imaging problem illustrated in
![]()
Figure 1.
1.1 Review of the PSM algorithm
Migration algorithms are simplified to be an inverse problem with the assumption that the targets are the sources of the received waves. Here, we assume that all scattering targets are located in down half space medium 2, and the back reflected signal is recorded along each sampling position at the height , where and are the horizontal position of the transceiver. The response at the transceiver will simply be the superposition of each point on the target multiplied by the round trip phase to that point. Then, we apply FFT over and is,
where indicates the array position; is wave-number of first layer, and represents the spatial wave-number of and respectively. We assume that the medium is isotropic and homogeneous. Therefore, we can use a single velocity for the wave propagation within each layer. For a homogeneous and lossless medium, it is obvious that , where is speed of light in free-space and is the relative electric permittivity of the medium. By utilizing the principle of stationary phase[
where is the target position, is the reflectivity function which is simply the ratio of reflected field to incident filed, and is the projection of the wave number in medium 1 along the z-axis
Suppose we shift down the transceiver along z-axis by , the FFT at new height is
By substituting Eq. 2 into Eq. 4, we can summarize the principle of PSM. In the wave-number domain, the wave of any depth of can be extrapolated from depth of by multiplication with a complex exponential:
Finally, an inverse Fourier transform (IFFT) can be applied to obtain the extrapolated wave field at in space-time coordinates.
By proper selecting and using Eq. 5, we can create the image increment-by-increment until the entire depth is imaged. To precisely generate an image, the increment is generally chosen to be smaller than the range resolution. When for a two-layer problem, the field cannot be extrapolated directly with different , referring to the medium relative permittivity, but the extrapolation method within each layer is similar, which is,
where, and denote the field at depth and , respectively. The transmission factors of different media are generally a complex function, dependent on both incident angle and the impedance of the media[
where, is the depth of first layer. By Eqs. 2-6, PSM can be chosen for the imaging of a two-layer model and be implemented for multi-layer medium imaging.
1.2 Proposed algorithm
It is a long execution time to create the image through PSM method. Note that for each layer, the wave velocity of the propagating medium is constant under the homogeneous assumptions. Therefore, Omega-k can be of particular interest in each layer since FFT and IFFT approach is significantly faster. According to Eq. 3, we have,
thus, we get,
By applying Eq. 8, we shift down the wave field at the top of the second layer, which equals to that the antenna is sampling at layer interface for the targets within second layer. Therefore, by substituting Eq. 8 into Eq. 7, we can use Omega-k algorithm to generate the image within each layer as follows,
where S is the wave field at each layer interface. As we know that in frequency wave-number space, if and are defined as uniform, the regular FFT algorithm cannot be directly evaluated on as it is non-uniform. Therefore, a re-interpolation from the k to domain is essential. The imaging procedure for a two-layer medium scenario is summarized in
![]()
Figure 2.Two-layer imagery: (a) the diagram of EWK algorithm; (b) the computational complexity with increased number of P
The size of the input data is given by the number of frequency samples (normally also the number of depth pixels), P, the number of measurement positions, M and N. For traditional back-projection method, the complexity is ), which is far more than EWK and PSM. For PSM and EWK, the asymptotic complexities of FFT operations are the same. However, for PSM, the complexity to iterative generate the image pixel-by-pixel is , whereas for EWK, the execution complexity by FFT operation is), where L is the medium layer number. When L is limited, it is obvious that EWK tends to have a lower complexity than PSM with regard to the increased P, as . Here, we give an example of computational time of PSM and EWK, respectively, shown in
1.3 Velocity estimation
The relative permittivity of the medium is an essential value that determines the wave transmission velocity in the respective medium. Unlike down-looking radar, for a two-layer medium, strong boundary reflection, transmission loss and wave scattering make it difficult to obtain the target curve directly for wave velocity estimation. In this paper, we propose a velocity estimation method based on the vertex region extraction; the reflected signal at the vertex region is highly sensitive to the change in wave velocity due to the multiple mediums. The procedure can be summarized as three steps:
i. Establish image data matrix referring to velocity change .
Radar transmission speed in the second layer is assumed to be and is velocity interval. Typical underground medium may involve different relative permittivity. Choose a set of B-scan data and substitute into (7) in sequence. Then, we generate the image data matrix towards.
ii. Extract Target region.
In the data matrix, we define the relative difference function between the normalized average value and the maximum value of as below,
The target image can be expressed as the point spread function in Sinc function. The difference between the focused image and the defocused image is the peak value. A wrong velocity will blur the image, along with the decrease of the peak amplitude value of the image. For a cluttered area after applying Eq. 12, approximates to zero, because the clutter energy value has little relations with within the medium layer. However, for the target region, the energy is the strongest with the correct wave velocity. Therefore, this valve will be significantly strengthened after Eq. 12. We define the normalized as,
Then, extract the target region as:
The region where corresponds to the curve at vertex region in the radar image, where the main component is the target echo hyperbola with very little clutter influence.
iii. Velocity Curve.
For the cluttered region, the amplitude along the axis decreases or rises monotonically, thus the vertex point typically arrives ator for monotonic properties; while for the target region, the amplitude appears to be a parabolic curve, the vertex point normally arrives at the central curve. We find the maximum point, and plot the energy curve refers to the. The maximum value position refers to the correct wave velocity, where the amplitude of the target is best focused after image processing.
2 Experimental validation
To do a realistic validation that EWK can produce high quality image with less time, an experiment with a two-layer structure was conducted as shown in
![]()
Figure 3.The standoff GPR design: (a) is the schematic of the circuit design; (b) is the experiment setup; (c) is the extension module; (d) are made of aluminum alloy sized 7 cm×7 cm with smooth surface, and (e) is a resolution plate sized of 25 cm×14 cm, and slot starts from 4 mm to 2.5 cm
The diagram shown in
The VDI module extends the frequency range of the 26.5 GHz PNA up to 75~110 GHz via AMC-i. A high direction coupler directs the transmitting signal and reference and measurement receive signals to form the S11 measurements via MixAMC-i. A single 23-dB gain horn antenna with 0.22 rad beam-width is used to transmit and receive the signal. Finally, the transmission coefficient was recorded by the VNA as the scattered data from the targets. Targets of different shapes are tested in the experiments. The ground medium is white sand. The calibrated data are stored and made available in the frequency domain in MATLAB data file format.
Before the experiment, velocity is firstly estimated. The X shape is buried in sand for 15 cm, and the matrix is generated by using EWK method. The threshold we chose is . Note that the parameter is the threshold to pick the target region out from the completely scanning scenario. In our paper, we use Gray Edge Cutting Method to find a proper to extract the strongest target region for velocity estimation[
3 Imaging results
We have conducted a couple of measurements to validate the proposed algorithm. In the first experiment, a resolution plate was buried in sand for 8 cm. The image results are shown in
![]()
Figure 4.Velocity estimation: (a) is the target curve and (b) is the clutter curve.
![]()
Figure 5.Results for resolution plate buried in sand for 8 cm. (a) image by PSM, (b) image by EWK, (c) 3D image, and (d) depth trace result
In the second experiment, X shape is buried in sand with depth of 10 cm, and O shape is put on the surface of the sand. We covered the sand surface with fresh-cut dry grass. The imaging results are shown in
![]()
Figure 6.Results for targets covering with grass and in sand.(a) O shape (b) X shape (c) 3D image, (d) depth trace
Unlike SAR image in free-space, the transmission loss in the standoff GPR is proportional to the buried depth. We pick out the maximum pixel of O shape and X shape, respectively, and plot the depth traces in
Afterwards, we re-buried the X shape target in sand for 15 cm and removed the grass. As shown in
![]()
Figure 7.Without grass and X shape is buried for 15 cm.(a) O shape and (b) X shape
We compare our work with current state art of work[
4 Conclusions
In summary, by integrating the Omega-k method into the PSM, this paper presents a new EWK method for multi-layer medium imaging along with a velocity estimation method for two-layer medium. The algorithm can achieve imagery using Omega-k method with transmission velocity changes. We have shown theoretically that the algorithm has lowered computational complexity compared to the PSM algorithm with increased number of range intervals. The algorithm is formulated in 3D and been implemented for both 2D and 3D applications on synthetic data from a W band GPR prototype. Both 2D and 3D images of the data were presented. Images formed using the algorithm provide well-focusing features of the targets, even very close scattering mechanisms can be easily distinguished. The new method offers a promising faster solution with high fidelity, which provides the potential for various applications.
References
[1] Peng ZHANG, Xiao-Juan Zhang. A Novel Through-the-Wall Imaging Algorithm Combined with Phase Shift Migration and NUFFT. Chin. J electron, 26, 1096-1100(2017).
[2] Woong Kang. Kangwook. Multilayer Stolt Migration Algorithm for Subsurface Target Imaging in Oblique Layers. IEEE J of Selected Topics in Applied Earth Observations and Remote Sensing, 10, 4295-4304(2016).
[3] Wave equation migration with the phase-shift method. Geophysics, 43, 1342-1351(1978).
[4] Kun-Long GU, Gang WANG, Jian LI. Migration based SAR imaging for ground penetrating radar systems. Algorithms for Synthetic Aperture Radar Imagery X. United States(2003).
[5] Sevket Demirci, Enes Yigit, H Ismail.
[6] Sevket Demirci, Enes Yigit, H Ismail. . Synthetic aperture focusing of ultrasonic data from multilayered media using an Omega-k algorithm. frequency control, 47, 35-42(2012).
[7] R. H. Stolt. Migration by Fourier transform. Geophysics, 43, 23-48(1978).
[8] L Douglas. McMakin, Thomas E. Hall. Three-dimensional millimeter-wave imaging for concealed weapon detection. IEEE Trans on microwave theory and techniques, 49, 1581-1592(2001).
[9] A. Vaso, Dusan Petrovacki, Miro Govedarica. A new method to simultaneously estimate the radius of a cylindrical object and the wave propagation velocity from GPR data. Computers & Geosciences, 35, 1620-1630(2009).
[10] M Olga, Jesús Pérez, M. P. Catedra. Stationary phase method application for the analysis of radiation of complex 3-D conducting structures. IEEE Trans on Antennas and Propagation, 49, 724-731(2001).
[11] Otsu, N. A threshold selection method from gray-level histograms. cybernetics, 9, 62-66(1979).
[12] B. Du, W. Todd, M Jose. Millimeter wave imaging system for the detection of nonmetallic objects. May, 45, 5686-5692(2016).


Set citation alerts for the article
Please enter your email address

© Copyright 2018-2021 | Chinese Laser Press. All Rights Reserved 沪ICP备15018463号-20