
Weihao Mu, Xuehui Chen, Yu Zhang, Lei Huang, Darong Zhu, Bichun Dong. Surface Morphology Analysis and Roughness Prediction of 316L Stainless Steel by Selective Laser Melting[J]. Laser & Optoelectronics Progress, 2022, 59(7): 0714011
- Laser & Optoelectronics Progress
- Vol. 59, Issue 7, 0714011 (2022)
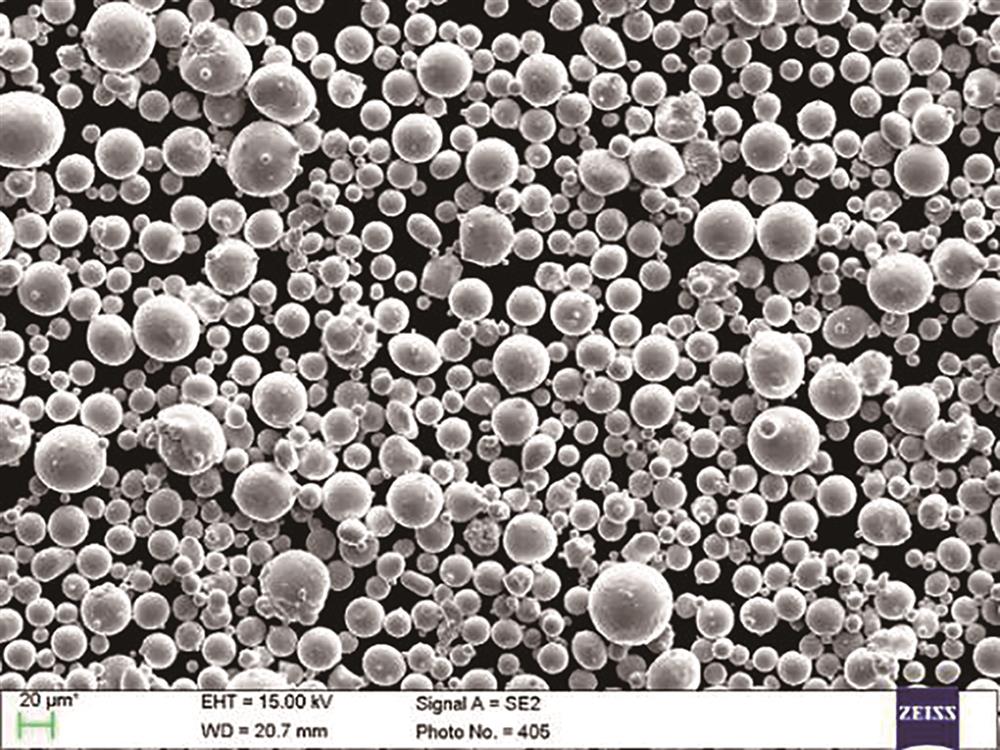
Fig. 1. Surface topography of 316L stainless steel powders
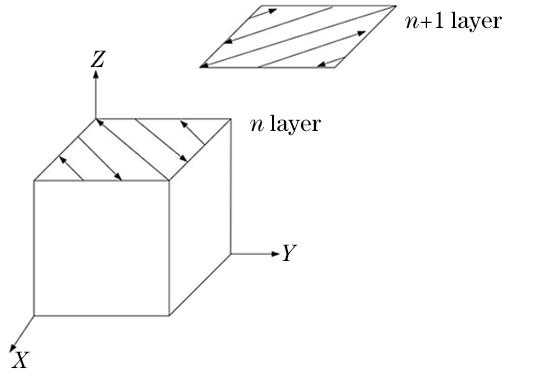
Fig. 2. Forming strategy of the SLM
Fig. 3. OM image of samples surface fabricated by SLM. (a) X-Y direction; (b) Y-Z direction
Fig. 4. SEM image of 316L stainless steel microstructure fabricated by SLM
Fig. 5. SEM images of the surface of SLM-formed samples under different LED. (a) 270 J/m; (b) 240 J/m; (c) 210 J/m; (d) 180 J/m; (e) 150 J/m
Fig. 6. SEM images of the surface of SLM-formed samples under different powers. (a) 140 W; (b) 160 W;
Fig. 7. Relationship between LED and surface roughness of samples under different laser power
Fig. 8. Structure of the BP neural network
Fig. 9. Flow chart of the GA-BP neural network
Fig. 10. Prediction error of GA-BP and BP neural networks
|
Table 1. Chemical components of 316L stainless steel powder
|
Table 2. Process parameters of the SLM
| |||||||||||||||||||||||||||||||||||||||||
Table 3. Surface roughness of samples with different laser power and LED
| ||||||||||||||||||||||||||||||||||||||||||||||
Table 4. Experimental and predicted results of surface roughness

Set citation alerts for the article
Please enter your email address
© Copyright 2018-2021 | Chinese Laser Press. All Rights Reserved 沪ICP备15018463号-20