• Photonics Research
  • Vol. 9, Issue 1, 1 (2021)
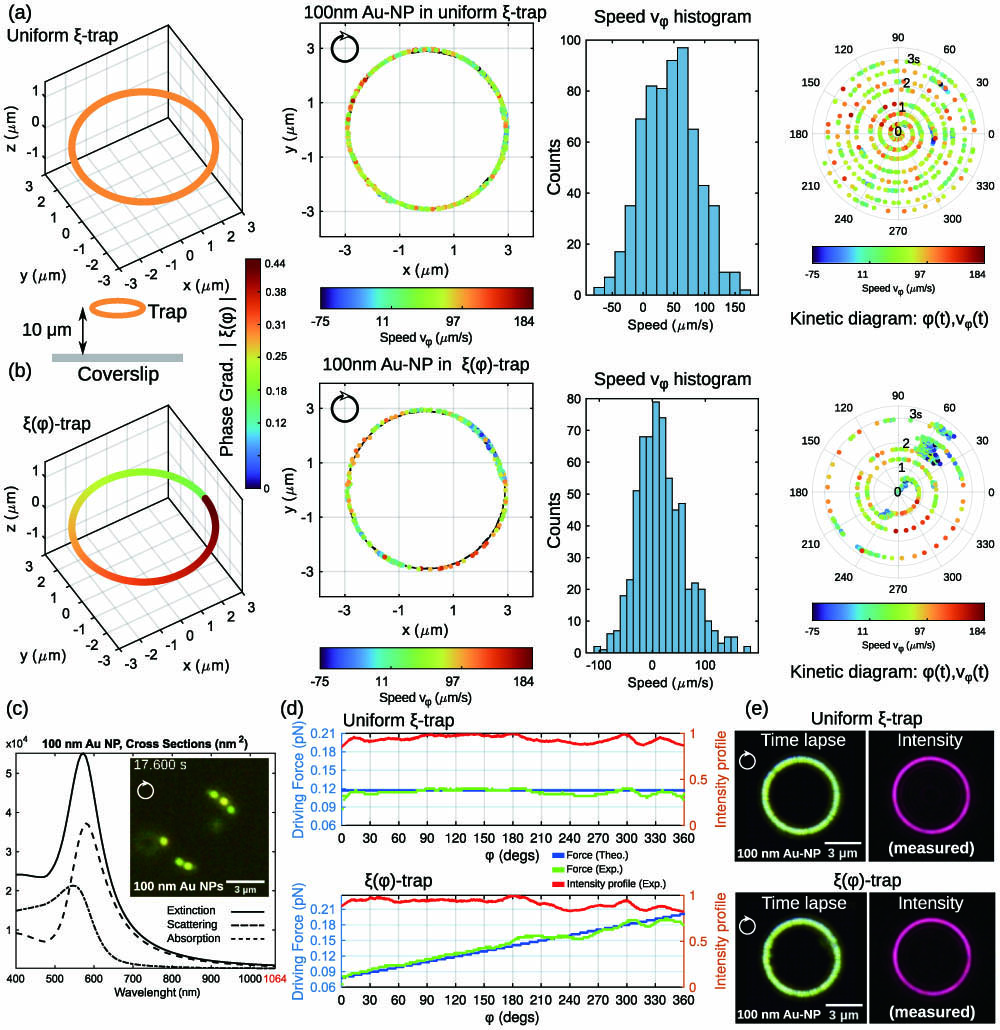
José A. Rodrigo*, Mercedes Angulo, and Tatiana Alieva
Author Affiliations
  • Universidad Complutense de Madrid, Facultad de Ciencias Físicas, Ciudad Universitaria s/n, Madrid 28040, Spain
  • show less
    DOI: 10.1364/PRJ.408680 Cite this Article Set citation alerts
    José A. Rodrigo, Mercedes Angulo, Tatiana Alieva. All-optical motion control of metal nanoparticles powered by propulsion forces tailored in 3D trajectories[J]. Photonics Research, 2021, 9(1): 1 Copy Citation Text show less
    (a) Ring ξ trap (R=3 μm radius) with phase gradient strength ξu=−0.28 induces clockwise NP (gold sphere of a=50 nm radius) transport motion around the ring. The next three plots in this row are used for NP motion analysis. The kinetic diagram represents the instantaneous tangential speed vφ(t) of the NP at the angular position φ(t). (b) The same as in (a) for ring ξ(φ) trap with ξ(φ)∝φ. The experimental results shown in (a) and (b) correspond to the NP motion observed in Visualization 1. (c) Cross sections of the considered gold NP; the inset dark-field image shows multiple gold NPs transported in the studied ring traps (Visualization 2); (d) predicted and estimated optical propulsion forces for each trap. The propulsion force has been estimated by using the measured intensity profile I(φ), red color plot (normalized intensity). (e) The time-lapse images (created from Visualization 1) coincide with the trapping beam’s shape (measured intensity) and confirm stable confinement and transport of the gold NP in the ring ξ trap and ξ(φ) trap.
    Fig. 1. (a) Ring ξ trap (R=3  μm radius) with phase gradient strength ξu=0.28 induces clockwise NP (gold sphere of a=50  nm radius) transport motion around the ring. The next three plots in this row are used for NP motion analysis. The kinetic diagram represents the instantaneous tangential speed vφ(t) of the NP at the angular position φ(t). (b) The same as in (a) for ring ξ(φ) trap with ξ(φ)φ. The experimental results shown in (a) and (b) correspond to the NP motion observed in Visualization 1. (c) Cross sections of the considered gold NP; the inset dark-field image shows multiple gold NPs transported in the studied ring traps (Visualization 2); (d) predicted and estimated optical propulsion forces for each trap. The propulsion force has been estimated by using the measured intensity profile I(φ), red color plot (normalized intensity). (e) The time-lapse images (created from Visualization 1) coincide with the trapping beam’s shape (measured intensity) and confirm stable confinement and transport of the gold NP in the ring ξ trap and ξ(φ) trap.
    (a) Calculated cross sections for a single silver NP (a=30 nm radius) and for a dimer with interparticle distance d=0 nm and d=10 nm; (b) measured dark-field images and time-lapse images illustrating the optical transport of the NPs around the considered ring traps (R=3 μm radius); see Visualization 3; (c) spectral response of the RGB camera along with the scattering cross sections for d=0 nm and d=10 nm. The corresponding predicted RGB color, shown in (d) for the case of a silver dimer with d=10 nm, is in good agreement with the experiment (measured RGB color) as displayed in the inset of (d).
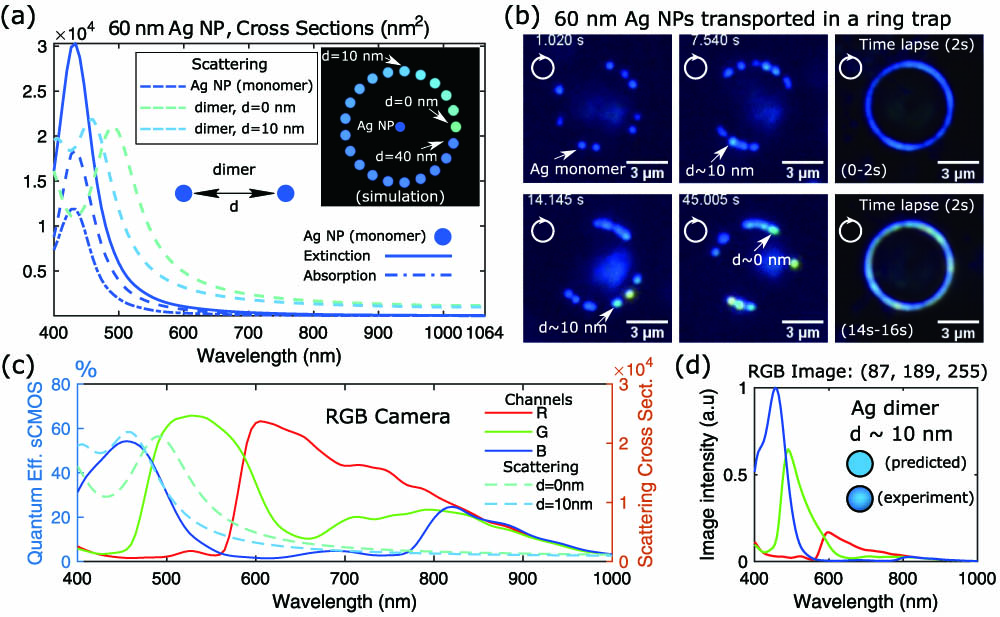
    Fig. 2. (a) Calculated cross sections for a single silver NP (a=30  nm radius) and for a dimer with interparticle distance d=0  nm and d=10  nm; (b) measured dark-field images and time-lapse images illustrating the optical transport of the NPs around the considered ring traps (R=3  μm radius); see Visualization 3; (c) spectral response of the RGB camera along with the scattering cross sections for d=0  nm and d=10  nm. The corresponding predicted RGB color, shown in (d) for the case of a silver dimer with d=10  nm, is in good agreement with the experiment (measured RGB color) as displayed in the inset of (d).
    (a) Phase-gradient strength obtained when a ring ξ trap (R=3 μm radius) is tilted by an angle β=10°; (b) measured dark-field images and time-lapse image illustrating the optical transport of silver NPs (a=30 nm radius) around the tilted ring trap (Visualization 4). The corresponding predicted and estimated optical propulsion forces are shown in (c). The maximum value of the phase-gradient force is obtained at φ=180°; its position is indicated by the arrow M in each case. (d) A ξ trap in the form of a vibrating string can be created by using dynamic shape morphing. The experimental results shown in (e) correspond to the optical transport of the silver NPs in this vibrating string (first row); see Visualization 5. The second row displays the measured beam’s intensity of several optical traps comprising the vibrating string.
    Fig. 3. (a) Phase-gradient strength obtained when a ring ξ trap (R=3  μm radius) is tilted by an angle β=10°; (b) measured dark-field images and time-lapse image illustrating the optical transport of silver NPs (a=30  nm radius) around the tilted ring trap (Visualization 4). The corresponding predicted and estimated optical propulsion forces are shown in (c). The maximum value of the phase-gradient force is obtained at φ=180°; its position is indicated by the arrow M in each case. (d) A ξ trap in the form of a vibrating string can be created by using dynamic shape morphing. The experimental results shown in (e) correspond to the optical transport of the silver NPs in this vibrating string (first row); see Visualization 5. The second row displays the measured beam’s intensity of several optical traps comprising the vibrating string.
    Sketch of the experimental setup used for 3D all-optical transport of NPs. The inverted dark-field microscope (comprising the condenser and objective lenses) has incorporated into two systems: the measurement setup required for visualization and position tracking of the NPs as well as the setup for shaping the laser traps (SLM and the laser device). The laser beam modulated by the SLM is relayed onto the back aperture of the objective lens by using a set of two identical convergent lenses (focal length of 200 mm) working as a 1× Keplerian telescope. Both the microscope’s tube lens (with focal length fTL=200 mm) and the RL (fRL=200 mm) are achromatic convergent lenses. The ETL (placed at d=150 mm from the camera) allows for optical scanning of the sample [41].
    Fig. 4. Sketch of the experimental setup used for 3D all-optical transport of NPs. The inverted dark-field microscope (comprising the condenser and objective lenses) has incorporated into two systems: the measurement setup required for visualization and position tracking of the NPs as well as the setup for shaping the laser traps (SLM and the laser device). The laser beam modulated by the SLM is relayed onto the back aperture of the objective lens by using a set of two identical convergent lenses (focal length of 200 mm) working as a 1× Keplerian telescope. Both the microscope’s tube lens (with focal length fTL=200  mm) and the RL (fRL=200  mm) are achromatic convergent lenses. The ETL (placed at d=150  mm from the camera) allows for optical scanning of the sample [41].
    Result of pmrf calculated from measured NP positions. This corresponds to an effective radial trapping potential experienced by a single gold NP in the ring uniform (a) ξ trap and (b) ξ(φ) trap. The black arrows indicate the regions (at φ∼60° and φ∼240°) of diminished radial trapping potential in the ξ(φ) trap.
    Fig. 5. Result of pmrf calculated from measured NP positions. This corresponds to an effective radial trapping potential experienced by a single gold NP in the ring uniform (a) ξ trap and (b) ξ(φ) trap. The black arrows indicate the regions (at φ60° and φ240°) of diminished radial trapping potential in the ξ(φ) trap.
    (a) Optical transport of silver NPs in a square ξ trap; see Visualization 6; (b) time-lapse images of the NPs motion during 10 and 6 s, respectively. The pink color observed in the first time-lapse image indicates the presence of a trimer [red color spot in image (a), at time 0.76 s] confined for a time of 4 s; then it escapes from the trap due to strong absorption of light (of the laser trapping beam). The shape of the time-lapse images coincides with the trapping beam’s intensity distribution shown in (b), as expected.
    Fig. 6. (a) Optical transport of silver NPs in a square ξ trap; see Visualization 6; (b) time-lapse images of the NPs motion during 10 and 6 s, respectively. The pink color observed in the first time-lapse image indicates the presence of a trimer [red color spot in image (a), at time 0.76 s] confined for a time of 4 s; then it escapes from the trap due to strong absorption of light (of the laser trapping beam). The shape of the time-lapse images coincides with the trapping beam’s intensity distribution shown in (b), as expected.
    José A. Rodrigo, Mercedes Angulo, Tatiana Alieva. All-optical motion control of metal nanoparticles powered by propulsion forces tailored in 3D trajectories[J]. Photonics Research, 2021, 9(1): 1
    Download Citation