
Wenhe Zhao, Yangyang Bai, Jinkai Wang, Lizhong Zhang. Accuracy analysis of a three-dimensional angle measurement sensor based on dual PSDs[J]. Infrared and Laser Engineering, 2024, 53(2): 20230543
- Infrared and Laser Engineering
- Vol. 53, Issue 2, 20230543 (2024)
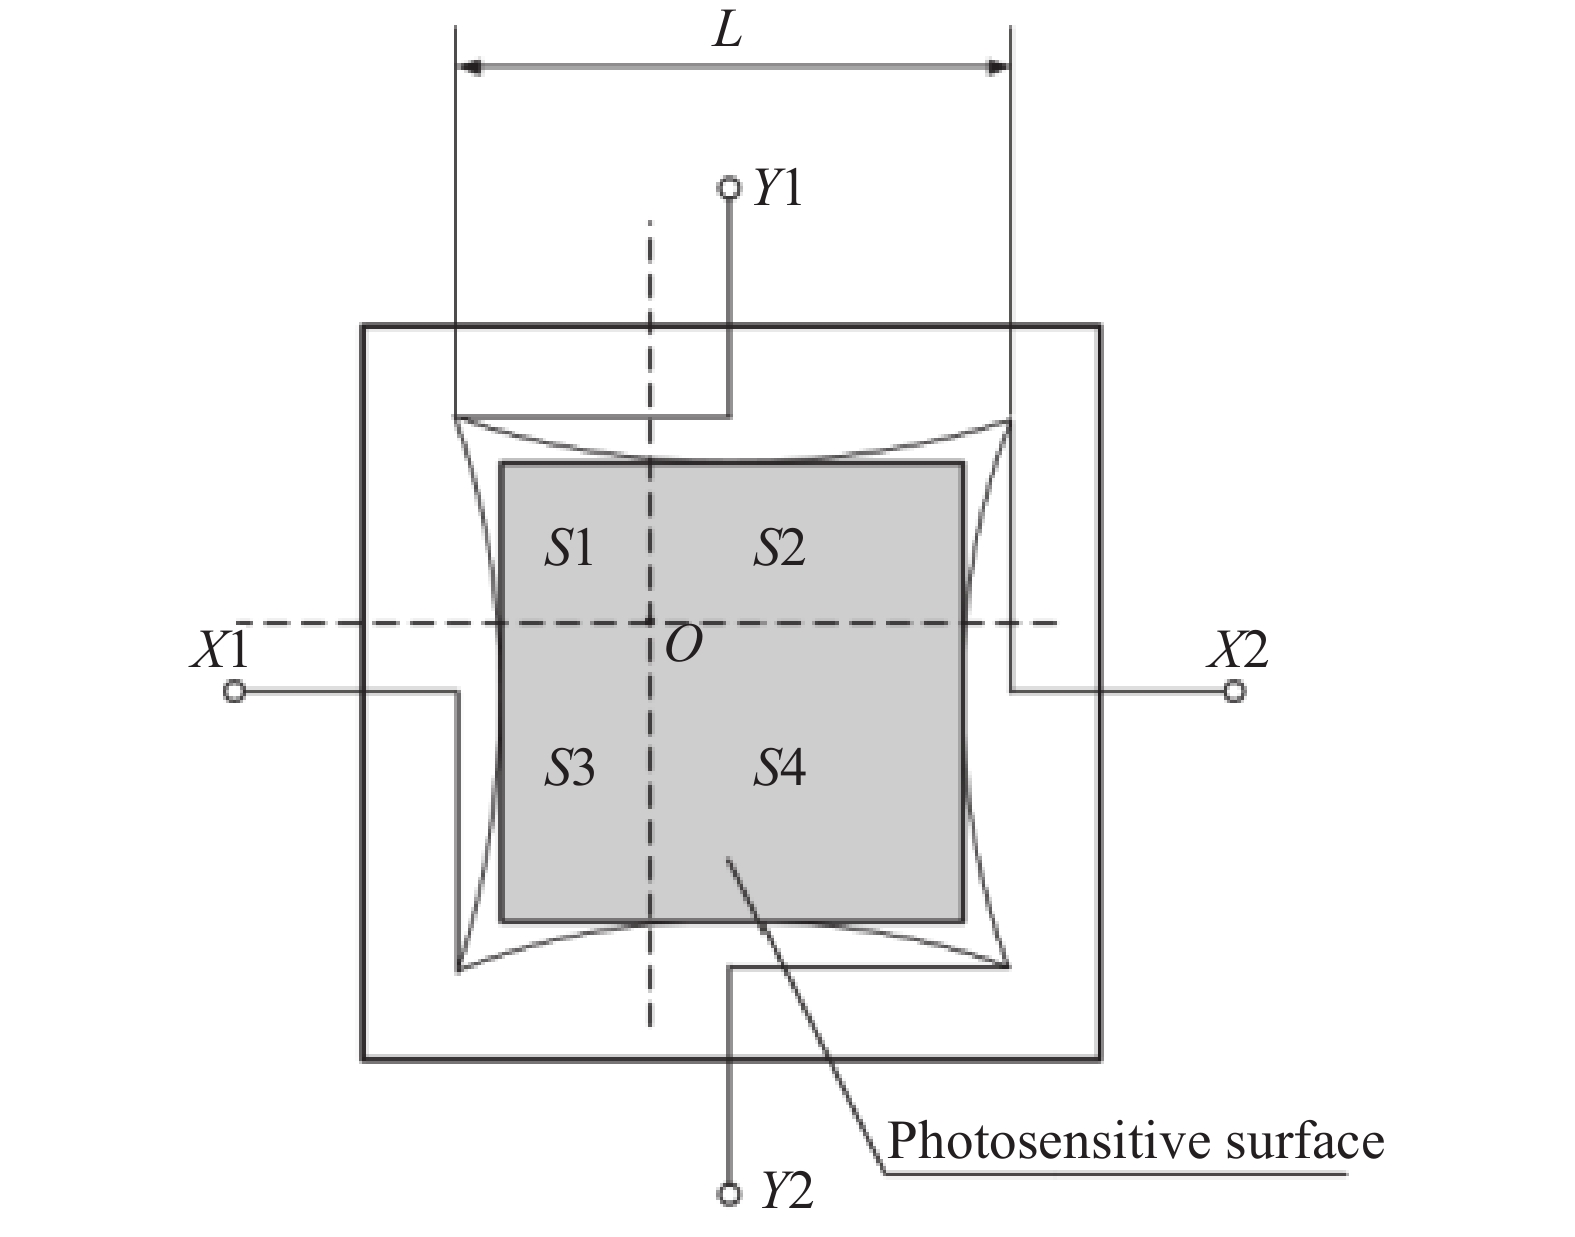
Fig. 1. Schematic diagram of 2D PSD structure
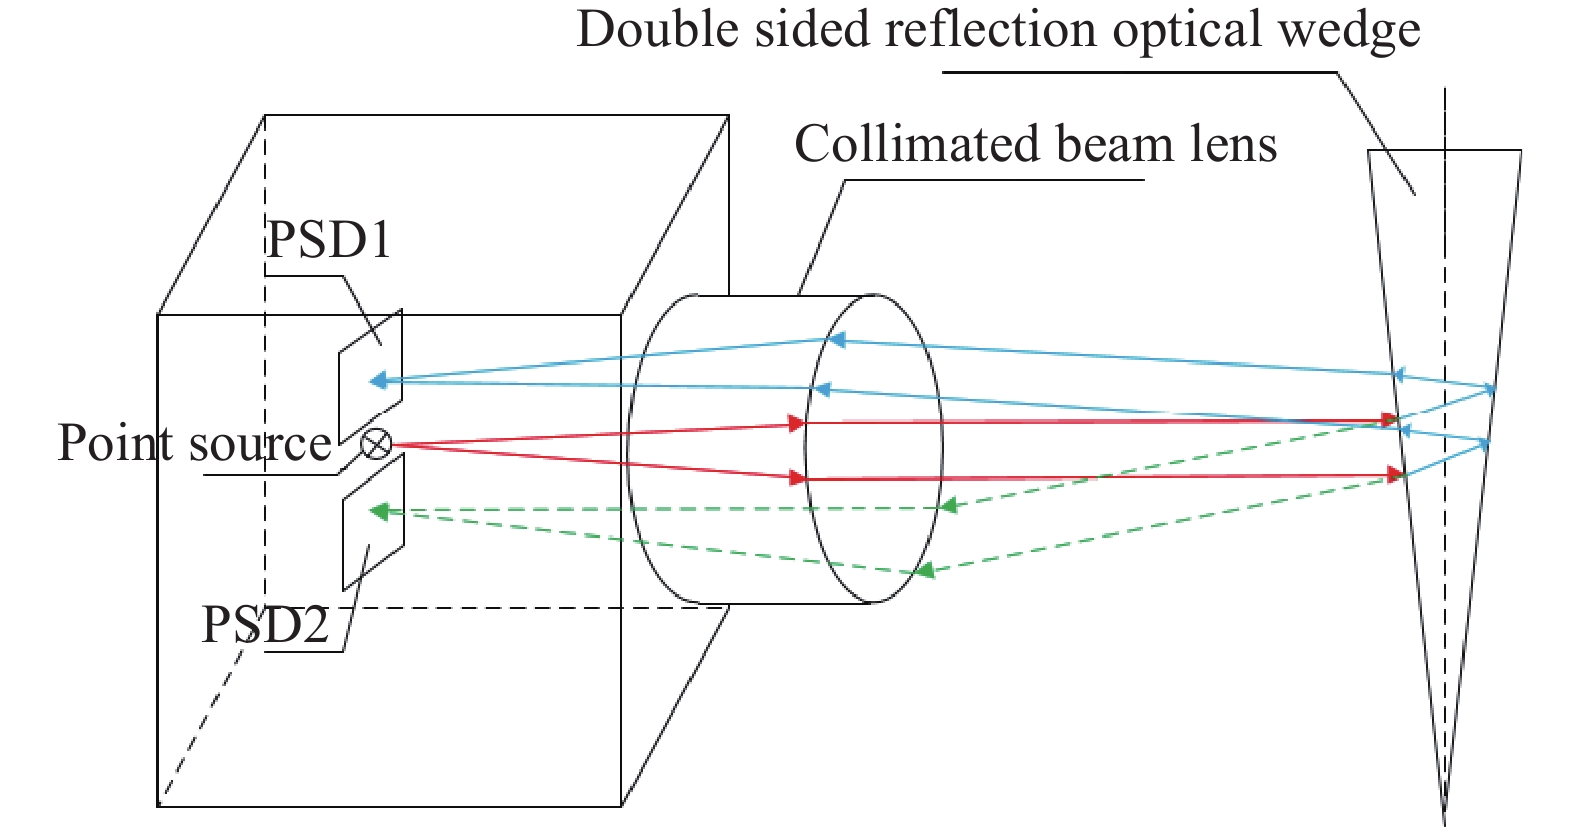
Fig. 2. Schematic diagram of dual PSD 3D angle measurement
Fig. 3. PSD signal processing circuit diagram
Fig. 4. Schematic diagram of the relative positions of two PSD
Fig. 5. Two PSD calibration experiments
Fig. 6. Two PSD calibration point positions
Fig. 7. Extracted analog signal noise signal
Fig. 8. (a) Noise fitting curve; (b) Curve after filtering with a 34th order FIR filter
Fig. 9. Curve plot of input signal frequency at (a) 1.00 Hz, (b) 10.00 Hz, (c) 100.00 Hz and (d) 1.00 kHz
Fig. 10. Curve plot of input signal frequency at (a) 184 Hz and (b) 1.31 kHz
Fig. 11. Comparison diagram between collected data and filtered data
Fig. 12. Comparison diagrams of (a) yaw angle measurement values, (b) pitch angle measurement values, (c) roll angle measurement values before and after filtering
Fig. 13. Angle measurement experimental system
|
Table 1. Performance indicators of each three-axis angle measurement methods
|
Table 2. Performance indicators of six axis hexapod nano displacement table
|
Table 3. Angle measurement error
|
Table 4. Experimental results of the effect of translation on angle measurement


Set citation alerts for the article
Please enter your email address

© Copyright 2018-2021 | Chinese Laser Press. All Rights Reserved 沪ICP备15018463号-20