
Xiaozhen Han, Yan Kang, Xiao Wu, Xueliang Liu, Shouguo Guo. Study on low-temperature heat treatment of purplish red sapphire[J]. Chinese Optics Letters, 2016, 14(5): 053001
- Chinese Optics Letters
- Vol. 14, Issue 5, 053001 (2016)
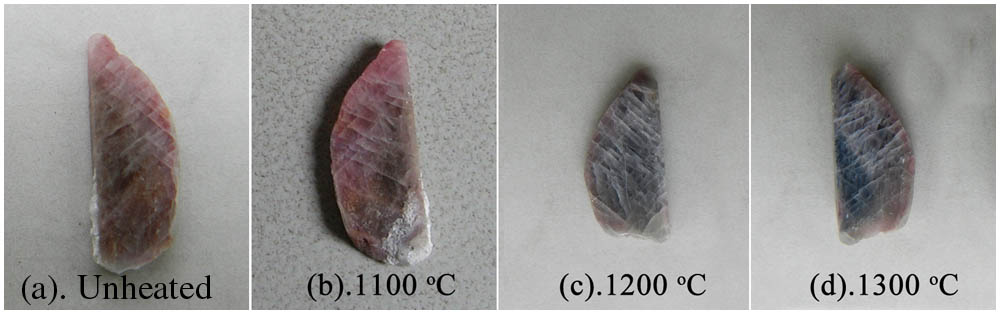
Fig. 1. Sample and its postheating color changes. (a) Photo of the unheated sample, photos of the sample heated at (b) 1100°C, (c) 1200°C, and (d) 1300°C.
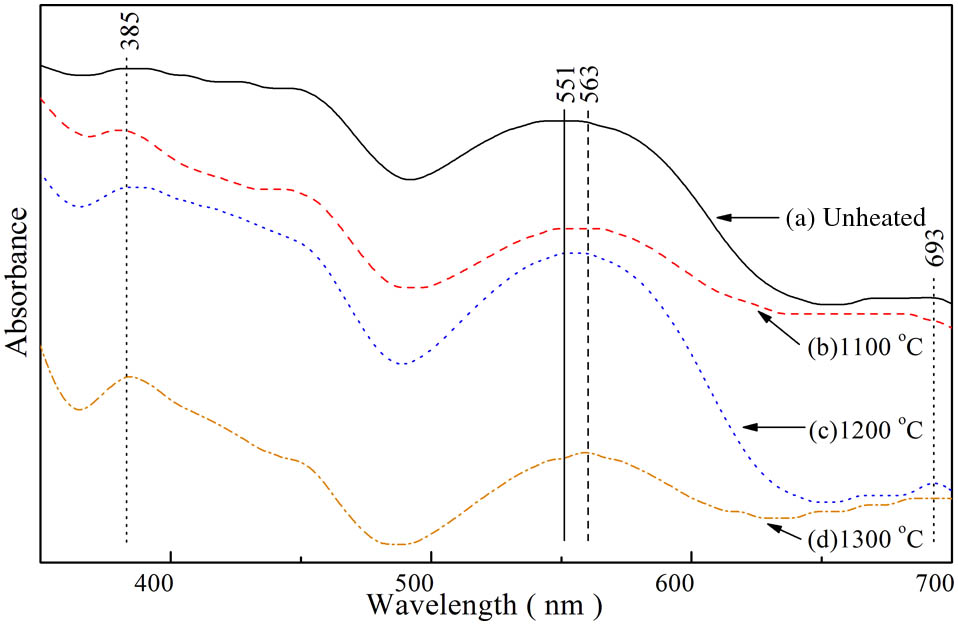
Fig. 2. Comparison of different UV-VIS absorption spectra of corundum samples before and after heat treatment. (a) UV-VIS absorption spectra of the unheated sample, UV-VIS absorption spectra of the sample heated at (b) 1100°C, (c) 1200°C, and (d) 1300°C.
Fig. 3. Observed and fitted absorption spectrum of the sapphire sample after it is heated at 1300°C (spectrum range from 490 to 640 nm).
Fig. 4. Observed and fitted x ray photoelectron spectrometer spectrum of Fe 2p from the surface of the sapphire sample: (a) unheated sample, sample heated at (b) 1100°C, (c) 1200°C, and (d) 1300°C.
Fig. 5. Observed and fitted x ray photoelectron spectrometer spectrum of Ti 2p from the surface of the sapphire sample: (a) unheated sample, sample heated at (b) 1100°C, (c) 1200°C, and (d) 1300°C.
|
Table 1. XRF Testing Results of the Sample (wt.%)
| ||||||||||||||||||||||||||||||||||
Table 2. X-ray Photoelectron Spectrometer Analysis Results of Fe 2p and Ti 2p Spectrum at Different Temperatures

Set citation alerts for the article
Please enter your email address
© Copyright 2018-2021 | Chinese Laser Press. All Rights Reserved 沪ICP备15018463号-20