
Song Xiang, Xinyu Zhang, Luogen Deng. Plasmon Mode Coupling Relationship and Optical Properties of Composite Structure[J]. Laser & Optoelectronics Progress, 2021, 58(9): 0924001
- Laser & Optoelectronics Progress
- Vol. 58, Issue 9, 0924001 (2021)
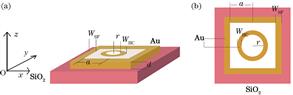
Fig. 1. CS model diagram. (a) Three-dimensional view; (b) top view
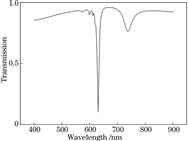
Fig. 2. Transmission spectra of CS model
Fig. 3. Transmission spectra of three models. (a) r=5 nm; (b) r=10 nm ; (c) r=15 nm ; (d) r=20 nm
Fig. 4. Transmission spectra of CS model of Au and Ag
Fig. 5. Transmission spectra of CS model with different parameter values r
Fig. 6. Full width at half maxima of peak valley with different parameter values r
Fig. 7. Absorption spectra of CS model with different parameter values r(inset is amplification in the wavelength range of 580 nm to 640 nm)
Fig. 8. Reflectance spectra of CS model with different parameter values r
Fig. 9. Distributions of electric field along the contact surface (
Fig. 10. Distributions of electric field on xz plane (y= 0)
Fig. 11. Transmission spectra of CS model with different parameter values a. (a) a=20 nm; (b) a=30 nm; (c) a=40 nm; (d) a=50 nm; (e) a=70 nm; (f)a=100 nm
Fig. 12. Electric field distributions of two resonant modes with different parameter values a on the dielectric surface
Fig. 13. Transmission spectra of CS model with different parameter values d. (a) d=10 nm; (b) d=20 nm; (c) d=30 nm; (d) d= 40 nm
Fig. 14. Variation trend of the wavelength of CS model with different parameter values d at the peak and valley
Fig. 15. Transmission spectra of CS model with different parameters values
Fig. 16. Transmission spectrum analysis charts of different parameter values
Fig. 17. Transmission spectra of CS model with different polarization angles

Set citation alerts for the article
Please enter your email address
© Copyright 2018-2021 | Chinese Laser Press. All Rights Reserved 沪ICP备15018463号-20