• Acta Optica Sinica
  • Vol. 40, Issue 17, 1722004 (2020)
Jia Si, Zexin Feng*, Dewen Cheng, and Yongtian Wang
Author Affiliations
  • Beijing Engineering Research Center of Mixed Reality and Advanced Display, School of Optics and Photonics, Beijing Institute of Technology, Beijing 100081, China
  • show less
    DOI: 10.3788/AOS202040.1722004 Cite this Article Set citation alerts
    Jia Si, Zexin Feng, Dewen Cheng, Yongtian Wang. Freeform Surface Beam Splitter for Discrete Spot Array with Prescribed Energy Proportion[J]. Acta Optica Sinica, 2020, 40(17): 1722004 Copy Citation Text show less
    Design schematic of free-form beam splitter
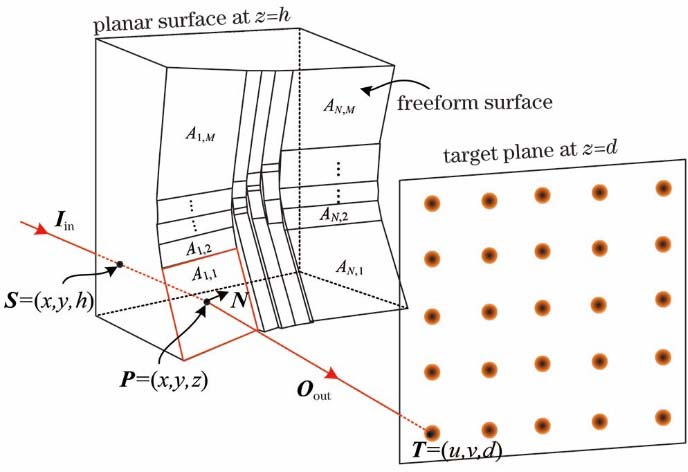
    Fig. 1. Design schematic of free-form beam splitter
    Schematic of subarea division of incident beam
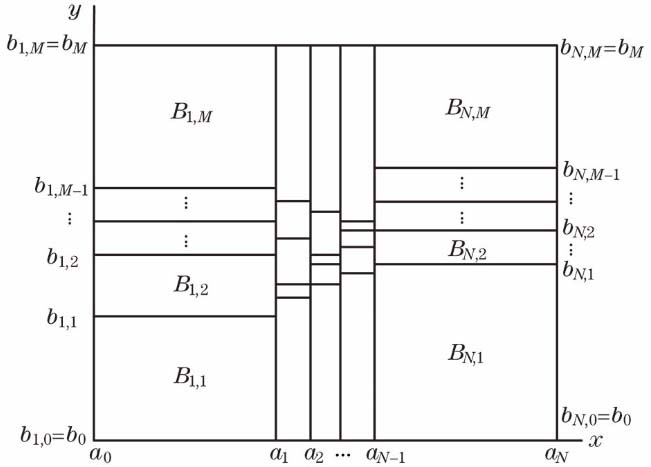
    Fig. 2. Schematic of subarea division of incident beam
    Schematic of ray map from subarea Bn,m to corresponding spot area Ωn,m
    Fig. 3. Schematic of ray map from subarea Bn,m to corresponding spot area Ωn,m
    Schematic of relationships between freeform surface data points and normal vectors
    Fig. 4. Schematic of relationships between freeform surface data points and normal vectors
    Model of FBS 1 and ray tracing illustration
    Fig. 5. Model of FBS 1 and ray tracing illustration
    Ray tracing simulation results of FBS 1. (a) 2D spot array; central irradiance profiles of (b) 5th column and (c) 1st row
    Fig. 6. Ray tracing simulation results of FBS 1. (a) 2D spot array; central irradiance profiles of (b) 5th column and (c) 1st row
    Physical optical simulation results of FBS 1. Simulated spot of A3,3 (a) true color, (b) false color; simulated spot of A1,1 (c) true color, (d) false color
    Fig. 7. Physical optical simulation results of FBS 1. Simulated spot of A3,3 (a) true color, (b) false color; simulated spot of A1,1 (c) true color, (d) false color
    FBS 2 model, ray tracing and energy scale diagram. (a) Model of FBS 2 and ray tracing illustration; (b) predefined energy proportion of target spot array
    Fig. 8. FBS 2 model, ray tracing and energy scale diagram. (a) Model of FBS 2 and ray tracing illustration; (b) predefined energy proportion of target spot array
    Ray tracing simulation results of FBS 2. (a) 2D spot array; central irradiance profiles of (b) 1st, (c) 2nd, (d) 3rd, (e) 4th, and (f) 5th column
    Fig. 9. Ray tracing simulation results of FBS 2. (a) 2D spot array; central irradiance profiles of (b) 1st, (c) 2nd, (d) 3rd, (e) 4th, and (f) 5th column
    Physical optical simulation results of FBS 2. Simulated spot of A3,3 (a) true color, (b) false color; simulated spot of A1,1 (c) true color, (d) false color
    Fig. 10. Physical optical simulation results of FBS 2. Simulated spot of A3,3 (a) true color, (b) false color; simulated spot of A1,1 (c) true color, (d) false color
    Edge profiles and sag mutation curves of sub-surfaces of FBS 1. (a) A1 and A5; (b) A2 and A4; (c) A3; (d) sag mutation curves between adjacent sub-surfaces
    Fig. 11. Edge profiles and sag mutation curves of sub-surfaces of FBS 1. (a) A1 and A5; (b) A2 and A4; (c) A3; (d) sag mutation curves between adjacent sub-surfaces
    Edge profiles and sag mutation curves of sub-surfaces of FBS 2. (a) A1; (b) A2; (c) A3; (d) A4; (e) A5; (f) sag mutation curves between adjacent sub-surfaces
    Fig. 12. Edge profiles and sag mutation curves of sub-surfaces of FBS 2. (a) A1; (b) A2; (c) A3; (d) A4; (e) A5; (f) sag mutation curves between adjacent sub-surfaces
    Jia Si, Zexin Feng, Dewen Cheng, Yongtian Wang. Freeform Surface Beam Splitter for Discrete Spot Array with Prescribed Energy Proportion[J]. Acta Optica Sinica, 2020, 40(17): 1722004
    Download Citation