Abstract
A phase demodulation method for quasi-distributed acoustic sensing (DAS) systems based on a dual-identical-chirped-pulse and weak fiber Bragg gratings (WFBGs) is proposed. Compared to the use of Rayleigh backscattering light in optical fibers, the implementation of WFBGs can contribute to obtaining an optical signal with a higher signal-to-noise ratio (SNR). The dual-identical-chirped-pulse is generated by a time-delay fiber, and the sinusoidal carrier is generated by the interference between the two chirped pulses reflected by adjacent WFBGs. The phase of the sinusoidal carrier represents the dynamic strain change posed on the sensing fiber. Discrete Fourier transform is used to directly retrieve the phase information. The performance of the phase demodulation from interference signals under different sinusoidal carrier frequencies and SNRs is numerically investigated. The piezoelectric transducer is employed to emulate the sound in the experiment to verify the effectiveness of our method. It is shown that the dynamic strain can be well reconstructed at the end of a 101.64 km fiber when the signal SNR is down to 3.234 dB. Our proposed method enables the application of the long-distance sensing in quasi-DAS systems.1. INTRODUCTION
Distributed acoustic sensing (DAS) systems have been widely used for ocean acoustic tomography, intrusion detection, structural health monitoring and railway safety monitoring, etc. [1–4]. DAS systems can be constructed with optical time-domain reflectometry (OTDR)-based or optical frequency-domain reflectometry (OFDR)-based technologies. Among these, the phase-sensitive optical time-domain reflectometry (-OTDR) technique has been intensively investigated. Wang et al. adopted in-phase/quadrature (I/Q) demodulation and homodyne detection to achieve the dynamic strain sensing with a sensing range of 12.56 km [5]. Lu et al. proposed a linear frequency-modulated optical pulse and matched filtering method, which achieved a vibration demodulation along a sensing distance of 19.8 km fiber [6]. He et al. adopted a dual-pulse probe and heterodyne detection method to simultaneously measure different types of vibration events along a 470 m sensing fiber [7]. Muanenda et al. used a dual-pulse probe and direct detection method to demodulate a 2 kHz disturbance at a sensing distance of 1.5 km [8]. Among OFDR-based DAS schemes, Chen et al. proposed a frequency-division-multiplexing time-gated digital OFDR technique to enlarge the response bandwidth, and it can detect two 9 kHz vibrations simultaneously along a 24.7 km sensing fiber [9]. Shiloh and Eyal demonstrated a simplified sinusoidal frequency scan and fast processing algorithm in a 64 km sensing fiber [10]. These methods utilized the Rayleigh backscattering (RBS) light in a single-mode fiber as the information carrier. However, the RBS light signal is generally weak, and thus the sensing distance is limited by the low SNR.
Recently, the weak fiber Bragg grating (FBG) arrays, which can be written into single-mode fibers with in-line writing techniques [11] and produce controllable and stable reflections to increase the SNR of the reflected signal, have been introduced into DAS. Am et al. detected small vibrations at the end of a 940 m length fiber with a discrete weak reflector array using double interrogation of OFDR [12]. Wang et al. demonstrated a phase-OTDR-based DAS system with 500 identical ultra-weak FBGs (UWFBGs) [13]. Li et al. adopted ultra-short FBG arrays and a dual-wavelength edge filtering to realize the static temperature measurement and dynamic strain sensing within a 2 km sensing distance [14]. Shan et al. employed UWFBG arrays and self-heterodyne detection for a dynamic strain sensing at the end of a 42 km sensing fiber [15]. However, the complicated phase demodulation process used in the previous methods and its performance for long-distance sensing need to be further evaluated.
In this paper, we propose a quasi-DAS demodulation method based on dual-identical-chirped-pulse and weak FBGs (WFBGs). The dual-identical-chirped-pulse is generated by a time delay, close to the round-trip time between two adjacent WFBGs. Compared with the methods that use an acoustic-optic modulator (AOM) [16] or two AOMs [7] to generate two pulses with different frequencies, the proposed dual-identical-chirped-pulse method can avoid the effect of modulation dither difference between two pulses to some degree. In addition, using chirped pulses via a dual-parallel Mach–Zehnder modulator (DP-MZM) can provide a more flexible control of the carrier frequency, which can be adjusted with the combination of the slope of chirp pulse and time delay. The system can be used for a WFBG array with a shorter space interval for denser quasi-distributed sensing cells with little demodulation system hardware change required, although that will be restricted by the rise/fall time of AOM and usually fixed-frequency shift for a specific product. The sinusoidal carrier is generated by the interference between the two chirped pulses reflected by adjacent WFBGs. The phase of the sinusoidal carrier represents the dynamic strain change in the sensing fiber. Discrete Fourier transform (DFT) is applied to retrieve the phase information directly. The performance of the phase demodulation from interference signals under different sinusoidal carrier frequencies and SNRs is numerically investigated. The piezoelectric transducer (PZT) is then employed to emulate the sound detection in the experiment to verify the effectiveness of the proposed method. It is found that the dynamic strain can be well reconstructed at the end of a 101.64 km fiber, of which the original signal SNR is only 3.234 dB for WFBGs with a nominal reflectivity of 0.5%. This method showed a strong anti-noise ability and is suitable to realize the long-distance quasi-DAS sensing.
2. PRINCIPLE
The schematic of the proposed quasi-DAS system is shown in Fig. 1. The light source is a narrow-linewidth laser (NLL), and its polarization state is adjusted by a polarization controller (PC). Then, the light beam is sent to the DP-MZM, where the continuous wavelength (CW) light is modulated into the chirped pulse. The signal power is then amplified by a booster erbium-doped fiber amplifier (EDFA1). The amplified chirped pulse is split by a coupler, and one branch is delayed by a delay fiber with a length of , where is the spacing between two neighbored WFBGs in the array, and is a preset small bias. The time delay between the two identical chirped pulses is , where is the refractive index, and is the light speed in the vacuum. The dual-identical-chirped-pulse is generated accordingly and is fed into the sensing fiber through the fiber circulator (Cir). After the reflection from WFBG arrays, the dual-identical-chirped-pulse passes through the circulator again and is projected into the pre-EDFA (EDFA2). Two adjacent reflected pulses will interfere and form a beat signal. Finally, the signal is received by a photodetector (PD) and recorded by an oscilloscope (OSC).
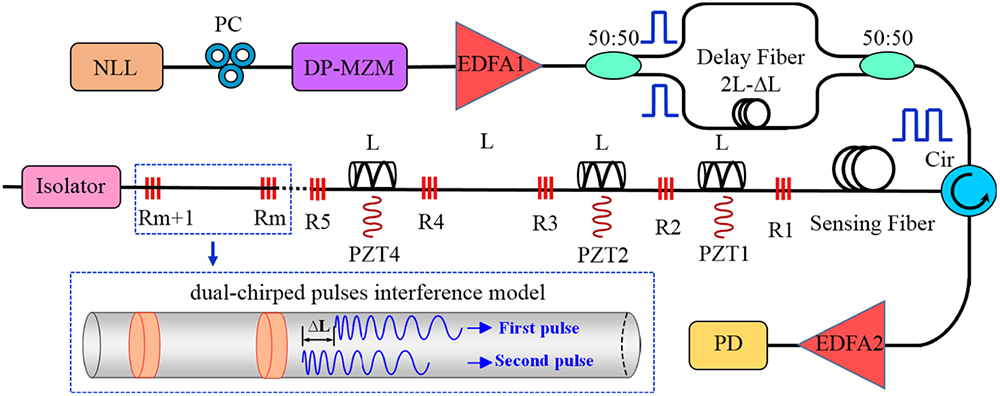
Figure 1.Schematic diagram of a WFBGs array system.
To explain the principle of our proposed scheme, we consider any two adjacent WFBGs in the sensing fiber, i.e., the th WFBG and the ()th WFBG, as shown in Fig. 1. We define the fiber section between them as the th fiber-sensing section. Note that there are two identical chirped pulses entering the WFBGs with a delay interval of . When the first one reaches the th sensing section, the electric field reflected by the ()th WFBG can be expressed as where , is the change of the fiber length caused by the longitudinal strain along the th sensing section, is the pulse width, is the optical frequency of CW light, is the start point of frequency sweeping, k is the sweeping slope of the chirped pulse, and is the reflectivity of the ()th WFBG.
Generally, the optical frequency is much larger than the modulation frequency, i.e., and , and thus Eq. (1) can be expressed as where is the variation of the phase difference originating from the change of .
When the second chirped pulse reaches the front end of the th sensing section, the electric field reflected by the th WFBG can be expressed as where is the reflectivity of the th WFBG, and is the time delay corresponding to the . Note that the two reflected pulses can form a beat frequency. The AC intensity of the output beating photocurrent could be expressed as where , and . It can be seen from Eq. (5) and Fig. 2(a) that the interference between the two chirped pulses produces a sinusoidal signal with a fixed frequency of .

Figure 2.DFT simulation results. (a) 3D spatial-temporal profile of original a 20 MHz sinusoidal signal with a varying phase without noise. (b) Phase demodulation result of a 20 MHz sinusoidal signal without noise. (c) 3D spatial-temporal profile of a 20 MHz noise-added sinusoidal signal with a varying phase. (d) Two noise-added signal traces at the moments of and . (e) Phase demodulation result of a 20 MHz noise-loaded sinusoidal signal. (f) R-squared and RMSE of phase demodulation results at different SNRs.
When the fiber in the th sensing section is deformed, the phase of the pulse passing through the fiber will change. The phase of the beat signal will change accordingly, and the interference waveform will shift. By calculating the phase of the single-frequency sinusoidal waveform, the phase change and the vibration of the sensing fiber can be obtained. Note that in the fiber-sensing system with coherent detection, the major noise is white noise [17], and it has an increasing effect on the SNR with the increase of distance, which will lead to a signal with a quite low SNR when the sensing target is far remote. DFT is a convenient method to retrieve the frequency-domain information [18–22]. Here, to suppress the impact of the white noise, we utilize the DFT-based phase demodulation to analyze the interference signal, of which the phase is proportional to the strain value. Because white noise is wideband and its energy is distributed evenly into all frequency components, here we only analyze the phase information for a fixed single-frequency sinusoidal signal. The sensing optical fiber is segmented to a sensing section array defined by WFBGs, and the carry frequency or target frequency of all sensing section is theoretically the same. The DFT is carried out with data of each sensing section one by one, and the phase of the target frequency reflects the dynamic strain applied onto the corresponding sensing section.
To prove the feasibility of this proposed phase demodulation method, we numerically investigated the phase extraction process for a 20 MHz sinusoidal signal. The pulse duration of the signal is 100 ns with a sampling frequency of 1 GHz, corresponding to 100 sampling points over a pulse duration. We add uniformly distributed noise to the signal to change its SNR. Figure 2(a) shows the original 20 MHz sinusoidal signal with a varying phase without any noise, in the three-dimensional (3D) spatial-temporal profile. Figure 2(b) shows the demodulated phase of the signal, which makes a perfect agreement with the loaded phase (). For a comparison, white noise is added to change the SNR to 0 dB, and the 3D spatial-temporal profile is depicted in Fig. 2(c). To clearly show the quality of the signal with the loaded noise, two signal traces at the moments and are presented in Fig. 2(d), from which it can be obviously found that the signal quality is quite low. Our phase demodulation result is shown in Fig. 2(e) with the R-squared of 0.9817, which means that when the noise intensity and signal intensity are comparable, an accurate phase demodulation can still be obtained using our proposed method. Moreover, to investigate the SNR limit of this method, we present the R-squared (red line) and root-mean-square error (RMSE, black line) versus SNR, illustrated in Fig. 2(f). The R-squared is 0.9744 and RMSE is 0.1728 at −5.0672 dB SNR, showing a very high anti-noise ability.
It is worth noting that although current technologies for writing identical WFBG arrays online can achieve a spatial error within [23], where the frequency of interference signals can be accurately controlled, the limitations on fabrications and success rates of online writing will lead to larger spatial errors for WFBG arrays. The corresponding discrete frequency may deviate from frequency set by the delay fiber and the spacing of the WFBG, and thus real phase information cannot be obtained directly through the frequencies of DFT. Suppose the frequency of the desired signal is , the sampling frequency is Fs, and the number of sampling points is ; then the frequency corresponding to the th point after DFT is , where represents the frequency resolution. The phase information at , which is close to the real beat frequency, is used as an approximate value. The proposed demodulation method could bring phase demodulation errors due to the window leakage effect, but this problem can be solved by windowing and interpolation [19–21]. In this paper, considering the simple verification of the proposed system and method, we still choose the use of the direct DFT-based phase demodulation.
3. EXPERIMENTAL RESULTS
In the experiment, the central wavelength of the NLL is 1550.12 nm with an output power of 16 dBm and a linewidth of 3 kHz. The modulating frequency of the DP-MZM changes from 22 to 300 MHz with a repetition period of 40 kHz. The pulse width of the generated chirped pulses is 100 ns, corresponding to a spatial resolution of 10 m, which is the ideal spacing of the WFBGs. The length of the delay fiber is 20.27 m, and the center wavelength of the WFBGs is 1550.12 nm with a nominal reflectivity of 0.5%.
Then, we connected five WFBGs (R1–R5) in the sensing fiber at the locations from 2005.40 to 2048.83 m, as shown in Fig. 1. Note that due to a manual operation error, the practical spacings of adjacent WFBGs are 10.83, 10.84, 10.86, and 10.90 m. Based on Eq. (5), the calculated beat frequencies are 18.99, 19.38, 19.90, and 20.82 MHz, respectively.
As presented in Fig. 3, there are four sensing sections named as sections 1, 2, 3, and 4. Sections 1, 2, and 4 are partly wound on cylindrical PZTs for and are stretched to emulate the dynamic strain from external acoustic waves. PZT1 (p43) and PZT2 (p52) are located next to each other to investigate possible cross talk between adjacent sensing sections. We load different sinusoidal voltages on PZT1, PZT2, and PZT4 (p52), which are Vpp, 2 Vpp, and 3 Vpp with the frequencies of 0.5, 1.0, and 2.0 kHz, respectively. The 3D spatial-temporal profile is presented in Fig. 3(a). It is found that the shift of the whole interference waveform for each sensing section scales sinusoidally with time, and the frequency shift of each interference waveform matches the voltage frequency of the loaded signal, as predicted by Fig. 2(a). The all-fiber signal at the moment and is shown in Fig. 3(b), and it is clearly shown that the light beam reflected by WFBG is much stronger than the RBS light in the fiber. The SNR is about 5.012 dB. Then, we zoom in on the orange dashed regime in Fig. 3(c). Comparing the waveform changes in different sections, it can be seen that the phase variation scales with the amplitude of the driving voltage, which is consistent with the previous theorical analyses.
Figure 3.Raw beat frequency signal at 2 km. (a) 3D spatial-temporal profile at the sensing section. (b) All-fiber signal at the moment and . (c) Sensing section signal at the moment and .
To verify the linear response of the proposed system, we measure the strain values exerted from the PZTs by fixing the frequency of sinusoidal driving voltage to be 1 kHz and increasing the voltage amplitude from 0.3 to 5 V. Note that two types of PZTs (p43 for PZT1, p52 for PZT2 and PZT4) are used, and both have been pre-calibrated by a Mach–Zehnder interferometer. The results for PZT1 and PZT2 are obtained individually. Figure 4(a) shows the reconstructed signal waveforms for PZT1 at different voltages, and it is observed that the dynamic strain amplitude increases almost linearly, from 11.75 to 216.19 nε, versus the voltage, compared to the fitted result (red line) shown in Fig. 4(b). Similarly, the reconstructed signal waveforms for PZT2 are also shown in Fig. 4(c), and the dynamic strain amplitude increases linearly with the voltage, from 8.30 to 134.77 nε, as illustrated in Fig. 4(d). The fitted R-squareds are 0.9995 and 0.9981, respectively, showing the high linearity of the proposed system.
Figure 4.Phase demodulation results of different types of PZTs. (a) Reconstructed signal waveforms for PZT1 at different voltages. (b) Demodulation results and fitting curves of different amplitude signals for PZT1. (c) Reconstructed signal waveforms for PZT2 at different voltages. (d) Demodulation results and fitting curves of different amplitude signals for PZT2.
To illustrate the multi-point simultaneous detection capability of the system, we load driving voltages with a fixed amplitude of 3 Vpp and different frequencies of 0.8, 1.0, and 1.2 kHz onto PZT1, PZT2, and PZT4, respectively. The corresponding reconstructed signal waveforms are all sinusoidal as presented in Figs. 5(a)–5(c). In the frequency domain, the peaks of the power spectra are located at 0.8, 1.0, and 1.2 kHz, and the overlaps of the power spectra are marginal, as shown in Fig. 5(d). This indicates that there is no cross influence among different sensing sections, showing that the system has a good multi-point detection capability.
Figure 5.Time-domain and frequency-domain plots of PZT at different frequencies. (a) Time-domain information of the phase demodulation result of the 0.8 kHz signal. (b) Time-domain information of phase demodulation result of the 1.0 kHz signal. (c) Time-domain information of phase demodulation result of the 1.2 kHz signal. (d) Frequency-domain information of demodulation results for 0.8, 1.0, and 1.2 kHz signals.
Next, we utilize the proposed system for long-distance sensing by replacing the 2 km fiber with a 101.6 km fiber (pulse repetition frequency 1.1 kHz) while keeping other components the same. Five WFBGs (R1–R5) are allocated from 101.59 to 101.64 km, and the four sections are shown in Fig. 6(a). The frequencies of the applied sinusoidal driving voltages for PZT1, PZT2, and PZT4 are 80, 90, and 100 Hz, respectively, with a same amplitude of 3 Vpp. It is seen that the trajectory of the interference waveform for each sensing section becomes fuzzy. At and , the received signals from sensing sections have a low SNR of , as shown in Fig. 6(b). The demodulated results of the low SNR signals using the proposed method are presented in Figs. 6(c) and 6(d) for sections 1 and 2, and the fitted values of R-squared are 0.9828 and 0.9681, respectively.
Figure 6.Raw beat frequency signal and phase demodulation results at 101 km. (a) 3D spatial-temporal profile at the sensing section. (b) Sensing section signal and power spectrum at the moment and . (c) The signal demodulation result of the sensing section 1. (d) The signal demodulation result of the sensing section 2.
Though the experiment is not a rigorous distributed sensing result, it provides some useful insights. First, there may exist some applications that require long-distance interrogation with a relatively small number of sensing cells at the connecting fiber end. The experiment results demonstrate a long-distance interrogation potential. Second, the experiment results give the optical power loss that the method can withstand, i.e., the anti-noise ability of the method. We can provide a theoretical estimation of the longest sensing distance when whole optical fiber is written with WFBG array. According to the maximum sensing distance of the system and the reflectivity of the WFBG in our experiment, the optical power loss returned by the WFBG at the end of the sensing fiber is calculated to be . Based on this, the longest sensing distance calculated is for a 10 m interval of WFBG array and WFBG reflectivity 0.01%. Therefore, the proposed method can be applied for a long-distance quasi-DAS system.
4. CONCLUSION
A demodulation method for quasi-DAS systems based on dual-identical-chirped-pulse and WFBGs has been proposed in this paper. The dual-identical-chirped-pulse is generated by a time-delay fiber, and the sinusoidal carrier is generated by the interference between two chirped pulses reflected by adjacent WFBGs. The phase of the sinusoidal carrier represents the dynamic strain change posed on the sensing fiber. DFT-based phase demodulation has been used to directly retrieve the phase information. Experimental results show that dynamic strain can be well reconstructed at the end of a 101.64 km fiber with a signal SNR down to 3.234 dB. This method provides a solution for quasi-DAS systems to achieve long sensing distance, dead-zone-free measurement, and high-precision sensing.
References
[1] P. Jousset, T. Reinsch, T. Ryberg, H. Blanck, A. Clarke, R. Aghayev, G. P. Hersir, J. Henninges, M. Weber, C. M. Krawczyk. Dynamic strain determination using fibre-optic cables allows imaging of seismological and structural features. Nat. Commun., 9, 2509(2018).
[2] G. Allwood, G. Wild, S. Hinckley. Optical fiber sensors in physical intrusion detection systems: a review. IEEE Sens. J., 16, 5497-5509(2016).
[3] A. Masoudi, T. P. Newson. Contributed review: distributed optical fibre dynamic strain sensing. Rev. Sci. Instrum., 87, 011501(2016).
[4] F. Peng, N. Duan, Y.-J. Rao, J. Li. Real-time position and speed monitoring of trains using phase-sensitive OTDR. J. Lightwave Technol., 26, 2055-2057(2014).
[5] Z. Wang, L. Zhang, S. Wang, N. Xue, F. Peng, M. Fan, W. Sun, X. Qian, J. Rao, Y. Rao. Coherent phi-OTDR based on I/Q demodulation and homodyne detection. Opt. Express, 24, 853-858(2016).
[6] B. Lu, Z. Pan, Z. Wang, H. Zheng, Q. Ye, R. Qu, H. Cai. High spatial resolution phase-sensitive optical time domain reflectometer with a frequency-swept pulse. Opt. Lett., 42, 391-394(2017).
[7] X. He, S. Xie, F. Liu, S. Cao, L. Gu, X. Zheng, M. Zhang. Multi-event waveform-retrieved distributed optical fiber acoustic sensor using dual-pulse heterodyne phase-sensitive OTDR. Opt. Lett., 42, 442-445(2017).
[8] Y. Muanenda, S. Faralli, C. J. Oton, F. Di Pasquale. Dynamic phase extraction in a modulated double-pulse varphi-OTDR sensor using a stable homodyne demodulation in direct detection. Opt. Express, 26, 687-701(2018).
[9] D. Chen, Q. Liu, X. Fan, Z. He. Distributed fiber-optic acoustic sensor with enhanced response bandwidth and high signal-to-noise ratio. J. Lightwave Technol., 35, 2037-2043(2017).
[10] L. Shiloh, A. Eyal. Sinusoidal frequency scan OFDR with fast processing algorithm for distributed acoustic sensing. Opt. Express, 25, 19205-19215(2017).
[11] Y. Wang, J. Gong, B. Dong, D. Y. Wang, T. J. Shillig, A. Wang. A large serial time-division multiplexed fiber Bragg grating sensor network. J. Lightwave Technol., 30, 2751-2756(2012).
[12] A. B. Am, D. Arbel, A. Eyal. OFDR with double interrogation for dynamic quasi-distributed sensing. Opt. Express, 22, 2299-2308(2014).
[13] C. Wang, Y. Shang, X. H. Liu, C. Wang, H. H. Yu, D. S. Jiang, G. D. Peng. Distributed OTDR-interferometric sensing network with identical ultra-weak fiber Bragg gratings. Opt. Express, 23, 29038-29046(2015).
[14] Z. Li, Y. Tong, X. Fu, J. Wang, Q. Guo, H. Yu, X. Bao. Simultaneous distributed static and dynamic sensing based on ultra-short fiber Bragg gratings. Opt. Express, 26, 17437-17446(2018).
[15] Y. Shan, W. Ji, X. Dong, L. Cao, M. Zabihi, Q. Wang, Y. Zhang, X. Zhang. An enhanced distributed acoustic sensor based on UWFBG and self-heterodyne detection. J. Lightwave Technol., 37, 2700-2705(2019).
[16] G. Yang, X. Fan, Q. Liu, Z. He. Frequency response enhancement of direct-detection phase-sensitive OTDR by using frequency division multiplexing. J. Lightwave Technol., 36, 1197-1203(2018).
[17] Y. Lu, T. Zhu, L. Chen, X. Bao. Distributed vibration sensor based on coherent detection of phase-OTDR. J. Lightwave Technol., 28, 3243-3249(2010).
[18] D. Belega, D. Dallet, D. Petri. Accuracy of sine wave frequency estimation by multipoint interpolated DFT approach. IEEE Trans. Instrum. Meas., 59, 2808-2815(2010).
[19] D. Agrez. Improving phase estimation with leakage minimization. IEEE Trans. Instrum. Meas., 54, 1347-1353(2005).
[20] J. Luo, Z. Xie, M. Xie. Interpolated DFT algorithms with zero padding for classic windows. Mech. Syst. Signal Process., 70–71, 1011-1025(2016).
[21] D. Belega, D. Petri. Sine-wave parameter estimation by interpolated DFT method based on new cosine windows with high interference rejection capability. Digit. Signal Process., 33, 60-70(2014).
[22] S. Schuster, S. Scheiblhofer, A. Stelzer. The influence of windowing on bias and variance of DFT-based frequency and phase estimation. IEEE Trans. Instrum. Meas., 58, 1975-1990(2009).
[23] H. G. Guo, J. T. Tang, X. L. Li, Y. Z. Zheng, H. Y. Yu. On-line writing identical and weak fiber Bragg grating arrays. Chin. Opt. Lett., 11, 030602(2013).


