
Wen Yu, Ni Yao, Jing Pan, Wei Fang, Xiong Li, Limin Tong, Lei Zhang. Highly sensitive and fast response strain sensor based on evanescently coupled micro/nanofibers[J]. Opto-Electronic Advances, 2022, 5(9): 210101
- Opto-Electronic Advances
- Vol. 5, Issue 9, 210101 (2022)
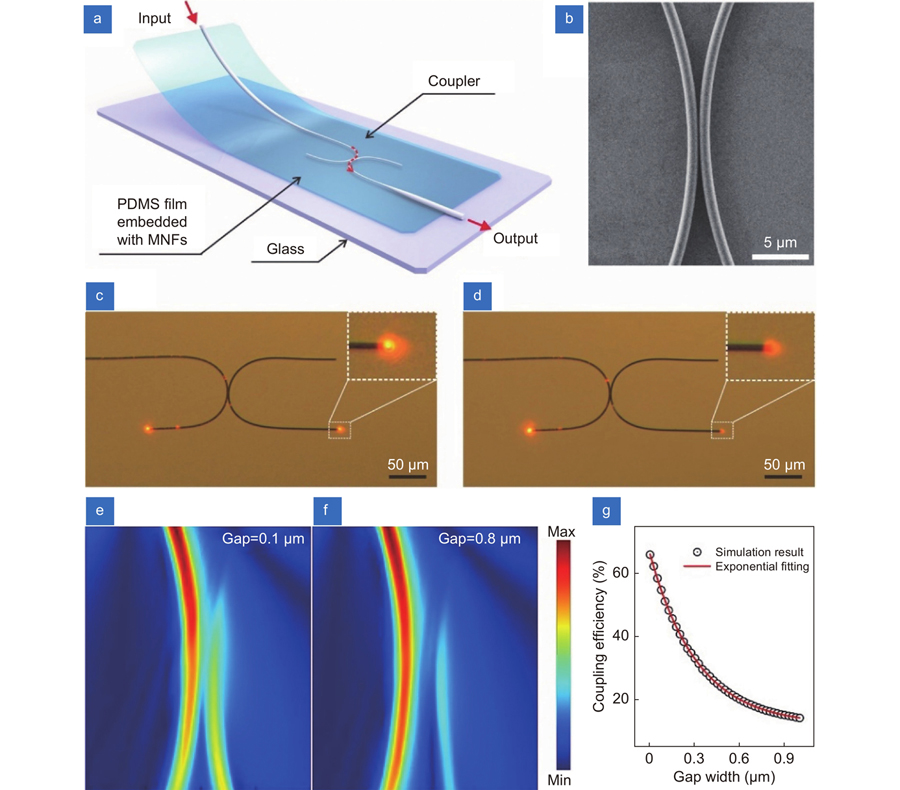
Fig. 1. Working principle of the strain sensor based on MNF coupler. (a ) Schematic diagram of a strain sensor structure. (b ) SEM image of the coupling region in a typical MNF coupler. (c , d ) Optical micrographs of an MNF coupler before and after slightly changing of the gap, respectively. The wavelength of input light is 660 nm. (e , f ) The simulated electromagnetic field intensity distributions of MNF coupling structures with gap widths of 0.1 μm and 0.8 μm, respectively. The diameter of each MNF is 0.9 μm and the bending radius is 50 μm. The refractive index of surrounding material is set as 1.40. (g ) The coupling efficiency as a function of gap width of coupled MNFs.
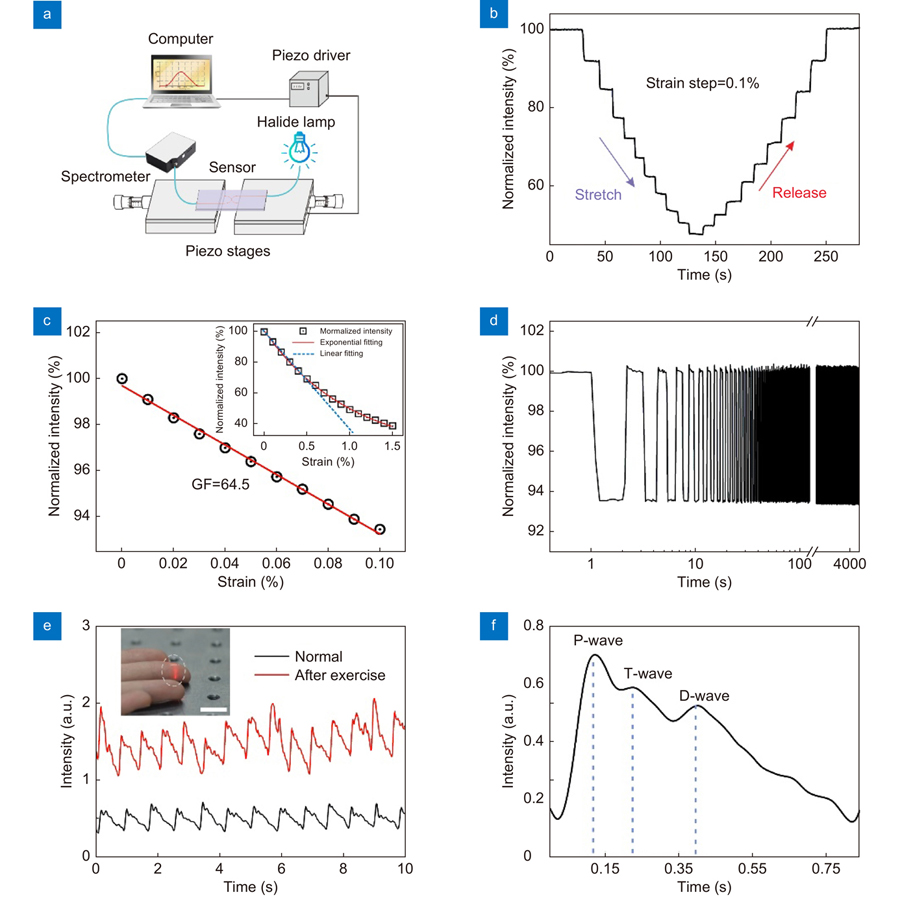
Fig. 2. The strain response of the sensor. (a ) Schematic diagram of the experimental setup for strain sensing. (b ) The response of the sensor in a stretch and release cycle reveals good reversibility of the device. (c ) Linear fitting of experimental data result in a GF of 64.5 within the strain range of 0.1%. Such linear relation can be extended to a strain range up to 0.5%, shown as the blue dotted-line in the inset, while the general relation between the normalized intensity and strain can be fitted by an exponential function in the strain range of 0–1.5%. (d ) The durability test for 2000 cycles under 0.1% strain. (e ) Measurement of the real-time fingertip pulse wave under normal conditions (72 beats per minute) and after exercise (85 beats per minute). The inset shows a photo of the sensor attached to the fingertip to test the pulse of the fingertip, and the scale bar is 1 cm. (f ) Typical measured pulse waveform with distinguishable P-wave, T-wave and D-wave peaks.
Fig. 3. Weak pressure signal detection. (a ) Schematic diagram of the sensor structure. (b ) Schematic diagram illustrates the pressure sensing mechanism. The vertical deformation of the film due to the exerted pressure causes the elongation of film. The enlargement of gap width results in a drop of coupling efficiency, as the simulated field distributions shown in the inset. The white circles indicate the location of MNFs. (c ) A photo of the sensor with a water droplet on the pressure sensitive area, the scale bar is 1.5 mm. (d ) The responses of the pressure sensor to water droplets with a maximum applied pressure of approximately 9 Pa.
Fig. 4. Characterization of the sensor for sound detection. (a ) Schematic diagram of the experimental setup for sound detection. (b ) The device response to sinusoidal sound waves at 0.5 kHz, 1 kHz, 2 kHz, respectively. (c ) The device response to a metronome at three different volumes (25, 50, and 70%). (d ) The device response to a piece of music. (e ) The sensor’s response to ultrasonic vibrations with a frequency of 30 kHz.


Set citation alerts for the article
Please enter your email address

© Copyright 2018-2021 | Chinese Laser Press. All Rights Reserved 沪ICP备15018463号-20