Abstract
Flexible strain sensors play an important role in electronic skins, wearable medical devices, and advanced robots. Herein, a highly sensitive and fast response optical strain sensor with two evanescently coupled optical micro/nanofibers (MNFs) embedded in a polydimethylsiloxane (PDMS) film is proposed. The strain sensor exhibits a gauge factor as high as 64.5 for strain ≤ 0.5% and a strain resolution of 0.0012% which corresponds to elongation of 120 nm on a 1 cm long device. As a proof-of-concept, highly sensitive fingertip pulse measurement is realized. The properties of fast temporal frequency response up to 30 kHz and a pressure sensitivity of 102 kPa?1 enable the sensor for sound detection. Such versatile sensor could be of great use in physiological signal monitoring, voice recognition and micro-displacement detection.Flexible strain sensors play an important role in electronic skins, wearable medical devices, and advanced robots. Herein, a highly sensitive and fast response optical strain sensor with two evanescently coupled optical micro/nanofibers (MNFs) embedded in a polydimethylsiloxane (PDMS) film is proposed. The strain sensor exhibits a gauge factor as high as 64.5 for strain ≤ 0.5% and a strain resolution of 0.0012% which corresponds to elongation of 120 nm on a 1 cm long device. As a proof-of-concept, highly sensitive fingertip pulse measurement is realized. The properties of fast temporal frequency response up to 30 kHz and a pressure sensitivity of 102 kPa?1 enable the sensor for sound detection. Such versatile sensor could be of great use in physiological signal monitoring, voice recognition and micro-displacement detection.Introduction
Strain sensors play an important role in many applications such as electronic skins1, 2, flexible electronics3, 4, health monitoring5-7, and soft robotics8, 9 due to their superb response to mechanical deformations. At present, the reported strain sensors mainly focus on high stretchability and high sensitivity under large deformation for motion detection10-17, yet low sensitivity under micro-deformation (≤1%) may limit their applications in micro-displacement detection (e.g., sound signal recognition) and weak physiological signal monitoring (e.g., pulsebeat detection).
Recently, various types of electronic strain sensors based on thickness gradient films18, gaps and islands structures19, percolation networks20 and microcracks21-25 have been demonstrated for sound pattern recognition and physiological signals detection. Among them, microcrack-based strain sensors, inspired by the crack-shaped slit organs of spider, exhibited ultrahigh sensitivity under micro deformation. For example, Kang et al. developed a highly sensitive nanoscale crack junction-based sensor for sensing micro-deformation by depositing 20 nm-thick platinum (Pt) layer on top of a viscoelastic polymer in the 0–2 percent strain range21. Ye et al. reported a single-crack-activated impedance strain sensor with unprecedented sensitivity in 10–4 strain range25. However, the complicated processing (deposition or plasma-exposure handling) and high sensitivity to electromagnetic disturbances are still challenges for their practical applications.
Alternatively, fiber based optical sensors offer attractive advantages compared with their electronic counterparts, including inherent electrical safety, immunity to electromagnetic interference, and small size. As a combination of fiber optics and nanotechnology, optical micro/nanofibers (MNFs) have been attracting increasing research interest due to their potential in renewing and expanding fiber optics26, 27 and flexible sensors at the micro/nano scale28-30. Especially, optical coupler based on evanescently coupled MNFs is a promising structure for highly sensitive optical sensing, as the coupling efficiency is strongly dependent on the ambient refractive index, the coupling length and the gap between the two adjacent MNFs31. For example, Chen et al. demonstrated an MNF coupler based Sagnac interferometer which is sensitive to microforce32. Note that, the as-fabricated MNF coupler was operated in open air, which is susceptible to environmental disturbance or surface contamination. Moreover, the Sagnac interferometer requires expensive apparatus (e.g., optical spectrum analyzer) to record the peak wavelength shift to achieve high sensitivity.
Herein, we design and fabricate a highly sensitive and fast response strain sensor based on two evanescently coupled MNFs that are encapsulated in a flexible PDMS film. Unlike the displacement sensor in which the coupled optical waveguide is directly exposed to the air33, the PDMS package not only avoids possible dust pollution, but also enhances the mechanical stability and robustness, which greatly expands the application range. The sensor demonstrates a gauge factor (GF) up to 64.5 in the strain range of 0–0.5%, a high strain resolution of 0.0012% which corresponds to a displacement of 120 nm on a 1 cm long device, and a fast temporal frequency response up to 30 kHz for sound detection. As a proof-of-concept, highly sensitive fingertip pulse measurement is realized. Such versatile sensor could be used in medical health monitoring, voice recognition, and micro-displacement detection.
Experimental section
Fabrication of MNFs
To fabricate the optical MNFs, we use a flame-heated mechanical stretching technique to draw the standard silica fiber into a biconical tapered fiber. In short, a section of 2 cm long coating of the standard optical fiber is stripped off, and both ends of the optical fiber are horizontally fixed by optical fiber holders so that the bare fiber section is suspended above the hydrogen flame. When the fiber is heated to its softening temperature, it is stretched on both ends until the waist diameter is reduced to the desired size.
Fabrication of the strain sensor
To fabricate the sensor structure shown in Fig. 1(a), we develop a three-step process. 1) 0.4 mL of degassed PDMS is poured onto a glass slide (7.62 cm × 2.54 cm), followed by curing at 80 °C for 20 minutes, forming a 200 μm-thick PDMS film; 2) A tungsten probe is used to cut the a biconical MNF into two symmetric MNFs. These two MNFs are placed on the PDMS film, and carefully manipulated by a fiber taper via a three-dimensional translation stage to form the coupler structure. In order to achieve a high coupling efficiency, we monitored the output optical intensity during the coupling process. The gap width between the two U-shape MNFs was adjust under an optical microscope until the output optical intensity reaches maximum. 3) The MNF-based coupler is enclosed by another layer of degassed PDMS on the top, followed by curing at room temperature for 24 hours.

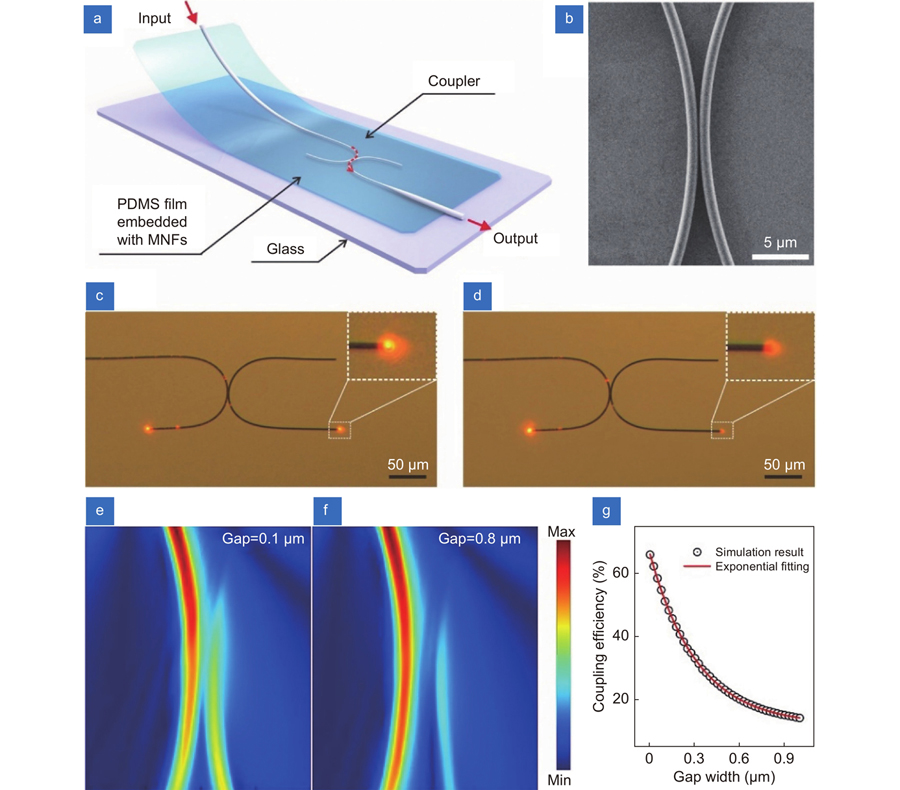
Figure 1.Working principle of the strain sensor based on MNF coupler.(a) Schematic diagram of a strain sensor structure. (b) SEM image of the coupling region in a typical MNF coupler. (c, d) Optical micrographs of an MNF coupler before and after slightly changing of the gap, respectively. The wavelength of input light is 660 nm. (e, f) The simulated electromagnetic field intensity distributions of MNF coupling structures with gap widths of 0.1 μm and 0.8 μm, respectively. The diameter of each MNF is 0.9 μm and the bending radius is 50 μm. The refractive index of surrounding material is set as 1.40. (g) The coupling efficiency as a function of gap width of coupled MNFs.
Instruments
A broadband light from a tungsten halide lamp (SLS202L, Thorlabs) with a spectral range from 360 nm to 2600 nm is used as a probing light. The transmitted light is directly coupled to a spectrometer (Maya2000 Pro, Ocean Optics, USA). When performing the detection to acoustic vibrations, a Si based photodetector (DET02AFC/M, Thorlabs, USA) is used to transfer the real-time optical signal from the sensor to electrical signal, and then displayed and recorded by an oscilloscope. The optical photos are acquired by a CCD camera (DS-Fi1, Nikon, Japan) mounted on an optical microscope (Eclipse 90i, Nikon, Japan). Strain testing is done using a piezoelectric translation stage (NFL5DP20, Thorlabs, USA).
Results and discussion
Concept and principle of the coupled strain sensor
The core of the sensor consists of two evanescently coupled U-shaped MNFs, as shown in Fig. 1(a). Each MNF is connected to a standard optical fiber via a taper region with high transmittance, so that optical signal can be transmitted from the input port to the output port via the coupling region, as indicated by the dotted red line. As the evanescent field decays exponentially outside the MNFs, the coupling efficiency is very sensitive to the gap between the two MNFs31. Thus, any displacement between two MNFs will be reflected upon the change of optical intensity at the output port, thereby realizing highly sensitive strain sensing. The whole structure is embedded in a PDMS film of appropriate thickness to ensure that the strain is transduced to the sensor with high fidelity. The PDMS film can isolate the sensing region from the air, thereby avoiding unpredictable signal interference caused by dust deposition and other external environmental changes. Since the refractive index of PDMS (n~1.40) is lower than that of SiO2 (n~1.46), PDMS can also effectively isolate the evanescent field of MNF from the environment while maintaining the mechanical flexibility of MNF. Moreover, the MNF embedded in PDMS has a lower refractive index contrast than that in air, which means the evanescent field of the MNF extends further in PDMS than in air. Therefore, the existence of PDMS film would boost the coupling efficiency. Based on the simulations reported in our previous work31, the coupling efficiency of two identical nanofibers depends on the evanescent field properties, gap width, and coupling length. Basically, MNF with smaller diameter has stronger evanescent field and more field extension outside the MNF, which is favorable for achieving a higher coupling efficiency. Such sensor may have larger strain detection range yet less sensitivity. Besides, a thinner MNF embedded in PDMS tends to result in a larger optical loss and wavelength-dependent evanescent leakage34. On the other hand, a larger bending radius is usually preferred to minimize light propagation loss and to increase the coupling length, however this will affect device compactness. In the experiments, we employ an MNF with diameter of 0.9 μm and bending radius of 50 μm as a result of trade-off between sensor sensitivity, detection range, and operating convenience. Although the thickness of the PDMS film has no effect on the coupling efficiency, a thinner PDMS film will produce greater deformation under the same stress, resulting in a higher sensitivity to stress. To enhance the device sensitivity, one can apply thinner PDMS film, thicker MNFs or replace PDMS with polymers with relatively lower refractive index, however, with the expense of smaller detection range.
Figure 1(b) shows a scanning electron microscope (SEM) image of the coupling region in a typical strain sensor. Each U-shaped MNF has a diameter of 0.9 μm and bending radius of 50 μm. The gap between MNFs in the figure is about 50 nm. Figure 1(c) and 1(d) shows that such coupler is sensitive to gap widths, as the output intensity changes dramatically when gap width changes slightly. To estimate the device response to displacement in such configuration, we carry out finite-difference time-domain (FDTD) simulation to calculate the coupling efficiency based on the experimental parameters. Fig. 1(e–f) shows the electromagnetic field intensity distributions of MNFs embedded in PDMS with gap widths of 100 nm and 800 nm, respectively. Owing to the exponential decay of the evanescent field outside the MNF, the coupling efficiency drops quickly from 51.2% (100 nm gap) to 16.2% (800 nm gap), as shown in Fig. 1(g). Thus, when a stain is exerted on the device, the deformation induced change of the gap width as well as effective coupling length will result in the variation of coupling efficiency.
Strain sensing
Figure 2(a) is a schematic diagram of the experimental setup for strain testing of the sensor. A halogen tungsten lamp and a spectrometer are used as the light source and detector, respectively. The PDMS film embedded with MNF coupler is attached to piezoelectric translation stages so that the strain can be controlled by a computer. The strain is defined as the length change over original length, e.g., the length change of 10 μm for a 1-cm-long PDMS film corresponds to a strain of 0.1%. As shown in Fig. S1, the output intensities at various wavelengths follow the same trend as strain changes, which means that the strain response is insensitive to wavelength. In this experiment, the intensity at 660 nm wavelength was recorded to test the strain sensing performance. Figure 2(b) plots the normalized output intensity change of the strain sensor in a stretch and release cycle. The change of length for each step is 10 μm, which corresponds to a strain change of 0.1%. The symmetrical response curve indicates a good reversibility of the sensor. The normalized intensity as a function of strain is extracted and plotted in the inset of Fig. 2(c), which fits well to an exponential function. The exponential relationship is also consistent with the FDTD simulation result shown in Fig. 1(g). As the curve changes slowly and smoothly in the strain range of 0–1.5%, one can always fit it with several sections of straight lines in narrower ranges. In the strain range of 0–0.5%, the experimental data result in a maximum gauge factor (GF) of the device as 64.5. The GF here is defined as (ΔI/I0)/Δε, where (ΔI/I0) is normalized intensity change and Δε is strain change. Based on such performance, the strain resolution of the device is estimated as 0.0012% considering the noise of the system is about 0.08%. This corresponds to the capability of detection elongation of 120 nm on a 1 cm long device. The durability of the sensor is tested by repeatedly stretch and release the device for 2000 times with strain ranging from 0 to 0.1%, as shown in Fig. 2(d). The result clearly indicates that the sensor has good stability and durability as the intensity baseline remains the same. It is worth noting that the sensor shows a wavelength-dependent response to temperature as shown in Fig. S2(a). To achieve an accurate strain measurement, one can avoid the influence of temperature fluctuations by choosing input light in the short wavelength range, or compensate the temperature-dependent response using the intensity-temperature relation as shown in Fig. S2(b). Besides, in some practical applications (e.g., physiological signal measurement), the temperature fluctuations are negligible and can barely bring any crosstalk to strain signals.
Figure 2.The strain response of the sensor. (a) Schematic diagram of the experimental setup for strain sensing. (b) The response of the sensor in a stretch and release cycle reveals good reversibility of the device. (c) Linear fitting of experimental data result in a GF of 64.5 within the strain range of 0.1%. Such linear relation can be extended to a strain range up to 0.5%, shown as the blue dotted-line in the inset, while the general relation between the normalized intensity and strain can be fitted by an exponential function in the strain range of 0–1.5%. (d) The durability test for 2000 cycles under 0.1% strain. (e) Measurement of the real-time fingertip pulse wave under normal conditions (72 beats per minute) and after exercise (85 beats per minute). The inset shows a photo of the sensor attached to the fingertip to test the pulse of the fingertip, and the scale bar is 1 cm. (f) Typical measured pulse waveform with distinguishable P-wave, T-wave and D-wave peaks.
Being sensitive to micro-strains, the sensor could be useful in diverse applications. For example, the sensor is suitable for the detection of strain related weak physiological signals of human body, e.g., pulse, due to the high flexibility of the device. Pulse signals are often measured by tying the sensor to the wrist35, 36. However this method requires precise positioning of the sensor and the measured waveform is sensitive to different wrist postures37. On the other hand, the fingertip with a convex surface is an ideal measurement site for stable long-term monitoring38. Nevertheless, the weak fingertip pulse signal requires highly sensitive sensors, thus hinders its application. To demonstrate fingertip pulse measurement, a 200 μm-thick PDMS film embedded with MNF coupler is gently laid on a middle fingertip without extra force, as shown in the inset of Fig. 2(e). The fingertip pulse rates can be accurately measured under normal condition and after physical exercise, as shown in Fig. 2(f) (Supplementary Movie 1 and 2). The curves clearly show that the pulse has higher rate and larger amplitude after exercise comparing to the one under normal condition. Benefitted from the high sensitivity, the sensor doesn’t need to be tightly bound to the wrist so that flow of blood will not be affected39, 40. As shown in Fig. 2(f), percussion wave (P-wave), tidal wave (T-wave), and diastolic wave (D-wave) are clearly visible, consistent with the high-fidelity recording of non-invasive radial pressure waves41. The experimental results prove that the sensor can be used as a wearable diagnostic device for real-time health monitoring.
Pressure detection
With high sensitivity to film deformation, our flexible sensor is also able to detect ultra-low pressure. A specially designed structure is adopted for better pressure response. As shown in Fig. 3(a), MNF coupler is firstly embedded in a 200-μm-thick PDMS film, and then attached to a 0.5-mm-thick PDMS film with a hole in it. The hole has a diameter of 3 mm, and the MNF coupler structure is freely suspended above the center of the hole. In this way, the free-standing thin PDMS film acts as a membrane that may respond to the pressure and deform promptly. As schematically shown in Fig. 3(b), the pressure detection is also based on coupling efficiency of the two MNFs. When a low pressure is exerted on the thin PDMS film, the film strains and conducts the deformation to the MNF coupler instantaneously, which causes changes of the gap width of the coupler. In short, the free-standing thin film transfers a vertical deformation to an elongation of PDMS film in horizonal direction with magnified amplitude. Therefore, the strain sensor works excellent in pressure measurement and is sensitive to tiny pressure.
Figure 3.Weak pressure signal detection. (a) Schematic diagram of the sensor structure. (b) Schematic diagram illustrates the pressure sensing mechanism. The vertical deformation of the film due to the exerted pressure causes the elongation of film. The enlargement of gap width results in a drop of coupling efficiency, as the simulated field distributions shown in the inset. The white circles indicate the location of MNFs. (c) A photo of the sensor with a water droplet on the pressure sensitive area, the scale bar is 1.5 mm. (d) The responses of the pressure sensor to water droplets with a maximum applied pressure of approximately 9 Pa.
Herein, pressure detection experiments are performed by various objects. As shown in Fig. S3, dropping and removing of a ladybird of 4 mg on the sensor cause drastic output intensity changes. To investigate the pressure detection sensitivity, we added 1-microliter-water-droplet on the surface of the sensor as shown in Fig. 3(c). When the number of droplets increases, the output light intensity decreases accordingly (Fig. 3(d)). It’s worth noting that the output light intensity undergoes a slow increase. This can be attributed to the evaporation of water droplet over time. The relationship between the normalized intensity and the pressure is plotted in Fig. S4. The linearly fitting of experimental data in the pressure range from 5 Pa to 9 Pa results in a pressure detection sensitivity as 102 kPa–1 (the pressure sensitivity is defined as (ΔI/I0)/ΔP, where ΔP is pressure change). Such sensitivity is about one order of magnitude higher than micro-pyramid based resistive sensors42 and graphene-based pressure sensors35, which is easy to be further improved.
Sound detection
The free-standing thin PDMS membrane over the 3-mm-diameter hole forms a sensitive device to pick up sound vibration, especially for high-frequency signals. To demonstrate the functionality of sound detection, we fixed the device shown in Fig. 3(a) to a stage so that the sensing area is facing a commercial speaker directly with a distance of two centimeters. To acquire instantaneous response, a photodetector is used instead of spectrometer, as shown in Fig. 4(a). The real-time optical signal is then converted into electrical signal and displayed by an oscilloscope. Fig. 4(b) shows the device response to sinusoidal sound waves at frequencies of 500 Hz, 1 kHz and 2 kHz, respectively. It is obvious that the sensor can reproduce sinusoidal signal at 1 kHz without distortion. The distortion of waveform at 2 kHz may stem from the high-frequency response limitation of the speaker. Fig. 4(c) and 4(d) show the sensor’s response to the amplitude of sound when the source are beats and a piece of music (Supplementary Movie 3 and 4). Here the signals are integrated over 20 ms so that only the amplitude of the sound is visible. One can clearly see the details of music in the magnified plot shown in Fig. S5. To investigate the high-frequency response of the device, we replace the speaker with an ultrasonic transducer. The reproduction of sinusoidal waveform at 30 kHz clearly indicates the fast temporal response of the device, as shown in Fig. 4(e). Such performance is not a surprise, as Yang et al. has reported an MNF-based sensor encapsulated in PDMS for ultrasound detection as well as its application in photoacoustic tomography43. A table comparing the performance of various electronic and optical strain sensors with that of the evanescently coupled MNF sensor we developed is presented in Supplementary Information Table S1. We believe, by optimizing the structure, the coupler-based MNF sensor may have outstanding performance in various applications that goes beyond ultrasound sensing.
Figure 4.Characterization of the sensor for sound detection. (a) Schematic diagram of the experimental setup for sound detection. (b) The device response to sinusoidal sound waves at 0.5 kHz, 1 kHz, 2 kHz, respectively. (c) The device response to a metronome at three different volumes (25, 50, and 70%). (d) The device response to a piece of music. (e) The sensor’s response to ultrasonic vibrations with a frequency of 30 kHz.
Conclusions
In summary, we have developed a highly sensitive and fast response flexible multi-functional sensor based on evanescently coupled MNFs that are encapsulated in a flexible, stretchable, and biocompatible PDMS film. The specially designed MNFs structure and the flexibility of PDMS endow the sensor with high sensitivity, high detection resolution and good ductility. This coupler-based sensor achieved a GF of 64.5 in the range of 0–0.5% strain, a strain detection resolution of 0.0012%, a fast temporal frequency response up to 30 kHz, and a pressure sensitivity of 102 kPa–1. These properties enable the sensor to detect real-time weak signals such as sound vibrations and human fingertip pulse. In addition, the sensor has properties as simple device structure, low requests for light source and detector. Moreover, taking advantage of wavelength-insensitive device response, halogen tungsten lamp and spectrometer used in the experiments can be replaced by cost-effective devices, such as an LED and photodiode, respectively, which is favorable for wearable weak physiological signal sensing system. We believe our new sensor open a simple route to low-cost, sensitive multifunctional flexible sensors with great potential in medical health monitoring, voice recognition, and micro-displacement detection.