
Rong-ke YE, Qing-chen KONG, Dao-liang LI, Ying-yi CHEN, Yu-quan ZHANG, Chun-hong LIU. Shrimp Freshness Detection Method Based on Broad Learning System[J]. Spectroscopy and Spectral Analysis, 2022, 42(1): 164
- Spectroscopy and Spectral Analysis
- Vol. 42, Issue 1, 164 (2022)
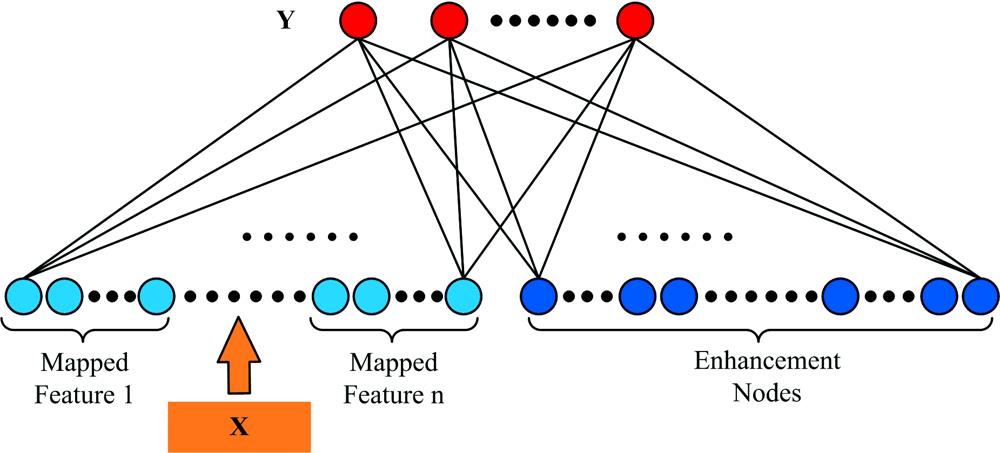
Fig. 1. Architecture of the broad learning system
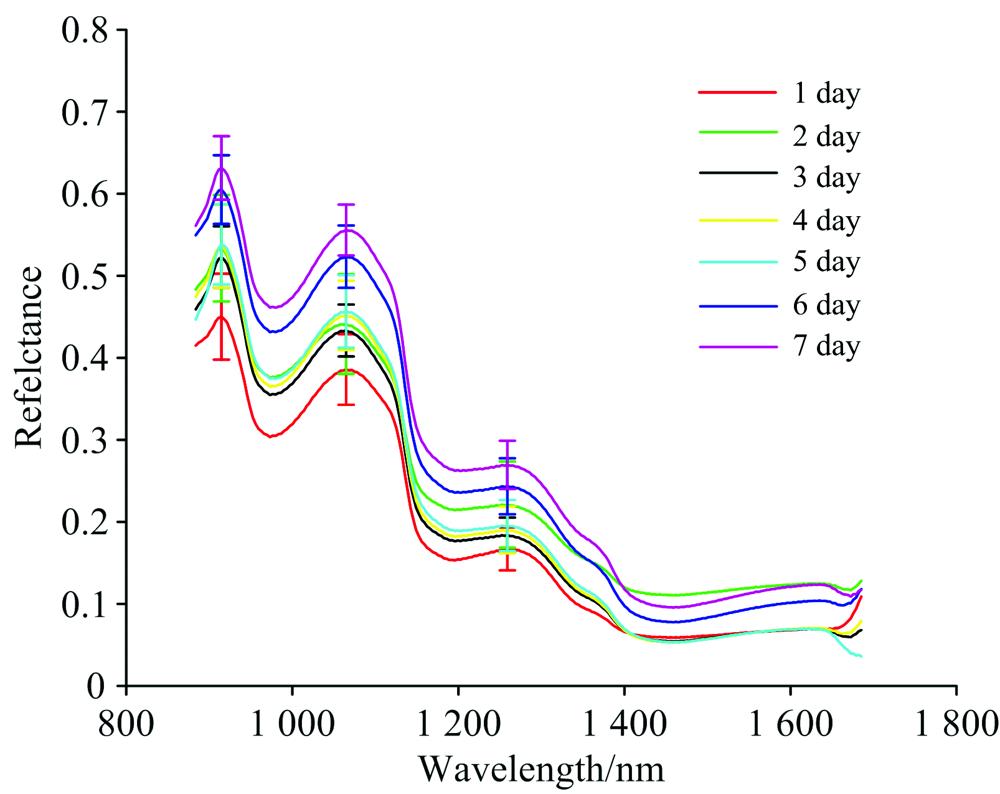
Fig. 2. Average spectral curves with standard deviation
Fig. 3. Visualization analysis
(a), (b), (c), (d): Spectral curves by using different preprocessing methods; (e), (f), (g), (h): Visualization using t-SNE
(a), (b), (c), (d): Spectral curves by using different preprocessing methods; (e), (f), (g), (h): Visualization using t-SNE
Fig. 4. Analysis of the importance of wavelength variables by RF
Fig. 5. Analysis of effective PC scores and loading
(a): PCA score plot of PC1vs. PC2; (b): Wavelength selection on PC1 and PC2 loading lines
(a): PCA score plot of PC1
Fig. 6. The 2D-COS spectrum of samples with different days of refrigeration
(a): Synchronous contourmap plot; (b): Autocorrelation peak intensity curve
(a): Synchronous contourmap plot; (b): Autocorrelation peak intensity curve
|
Table 1. Analysis of modeling results based on feature wavelengths

Set citation alerts for the article
Please enter your email address
© Copyright 2018-2021 | Chinese Laser Press. All Rights Reserved 沪ICP备15018463号-20