• Acta Optica Sinica
  • Vol. 40, Issue 22, 2211002 (2020)
Zhongjian Tian1, Haijun Yu2、3, Linbo Wang1, Zhenzhen Pi1, and Fenglin Liu1、2、3、*
Author Affiliations
  • 1State Key Laboratory of Mechanical Transmission, Chongqing University, Chongqing 400044, China
  • 2Key Laboratory of Optoelectronic Technology and Systems, Ministry of Education, Chongqing University, Chongqing 400044, China
  • 3Engineering Research Center of Industrial Computed Tomography Nondestructive Testing, Ministry of Education, Chongqing University, Chongqing 400044, China
  • show less
    DOI: 10.3788/AOS202040.2211002 Cite this Article Set citation alerts
    Zhongjian Tian, Haijun Yu, Linbo Wang, Zhenzhen Pi, Fenglin Liu. Orthogonal Translation Computed Laminography[J]. Acta Optica Sinica, 2020, 40(22): 2211002 Copy Citation Text show less
    Geometric model of OTCL system. (a) 3D scanning model; (b) scanning model in z direction; (c) scanning model in x direction
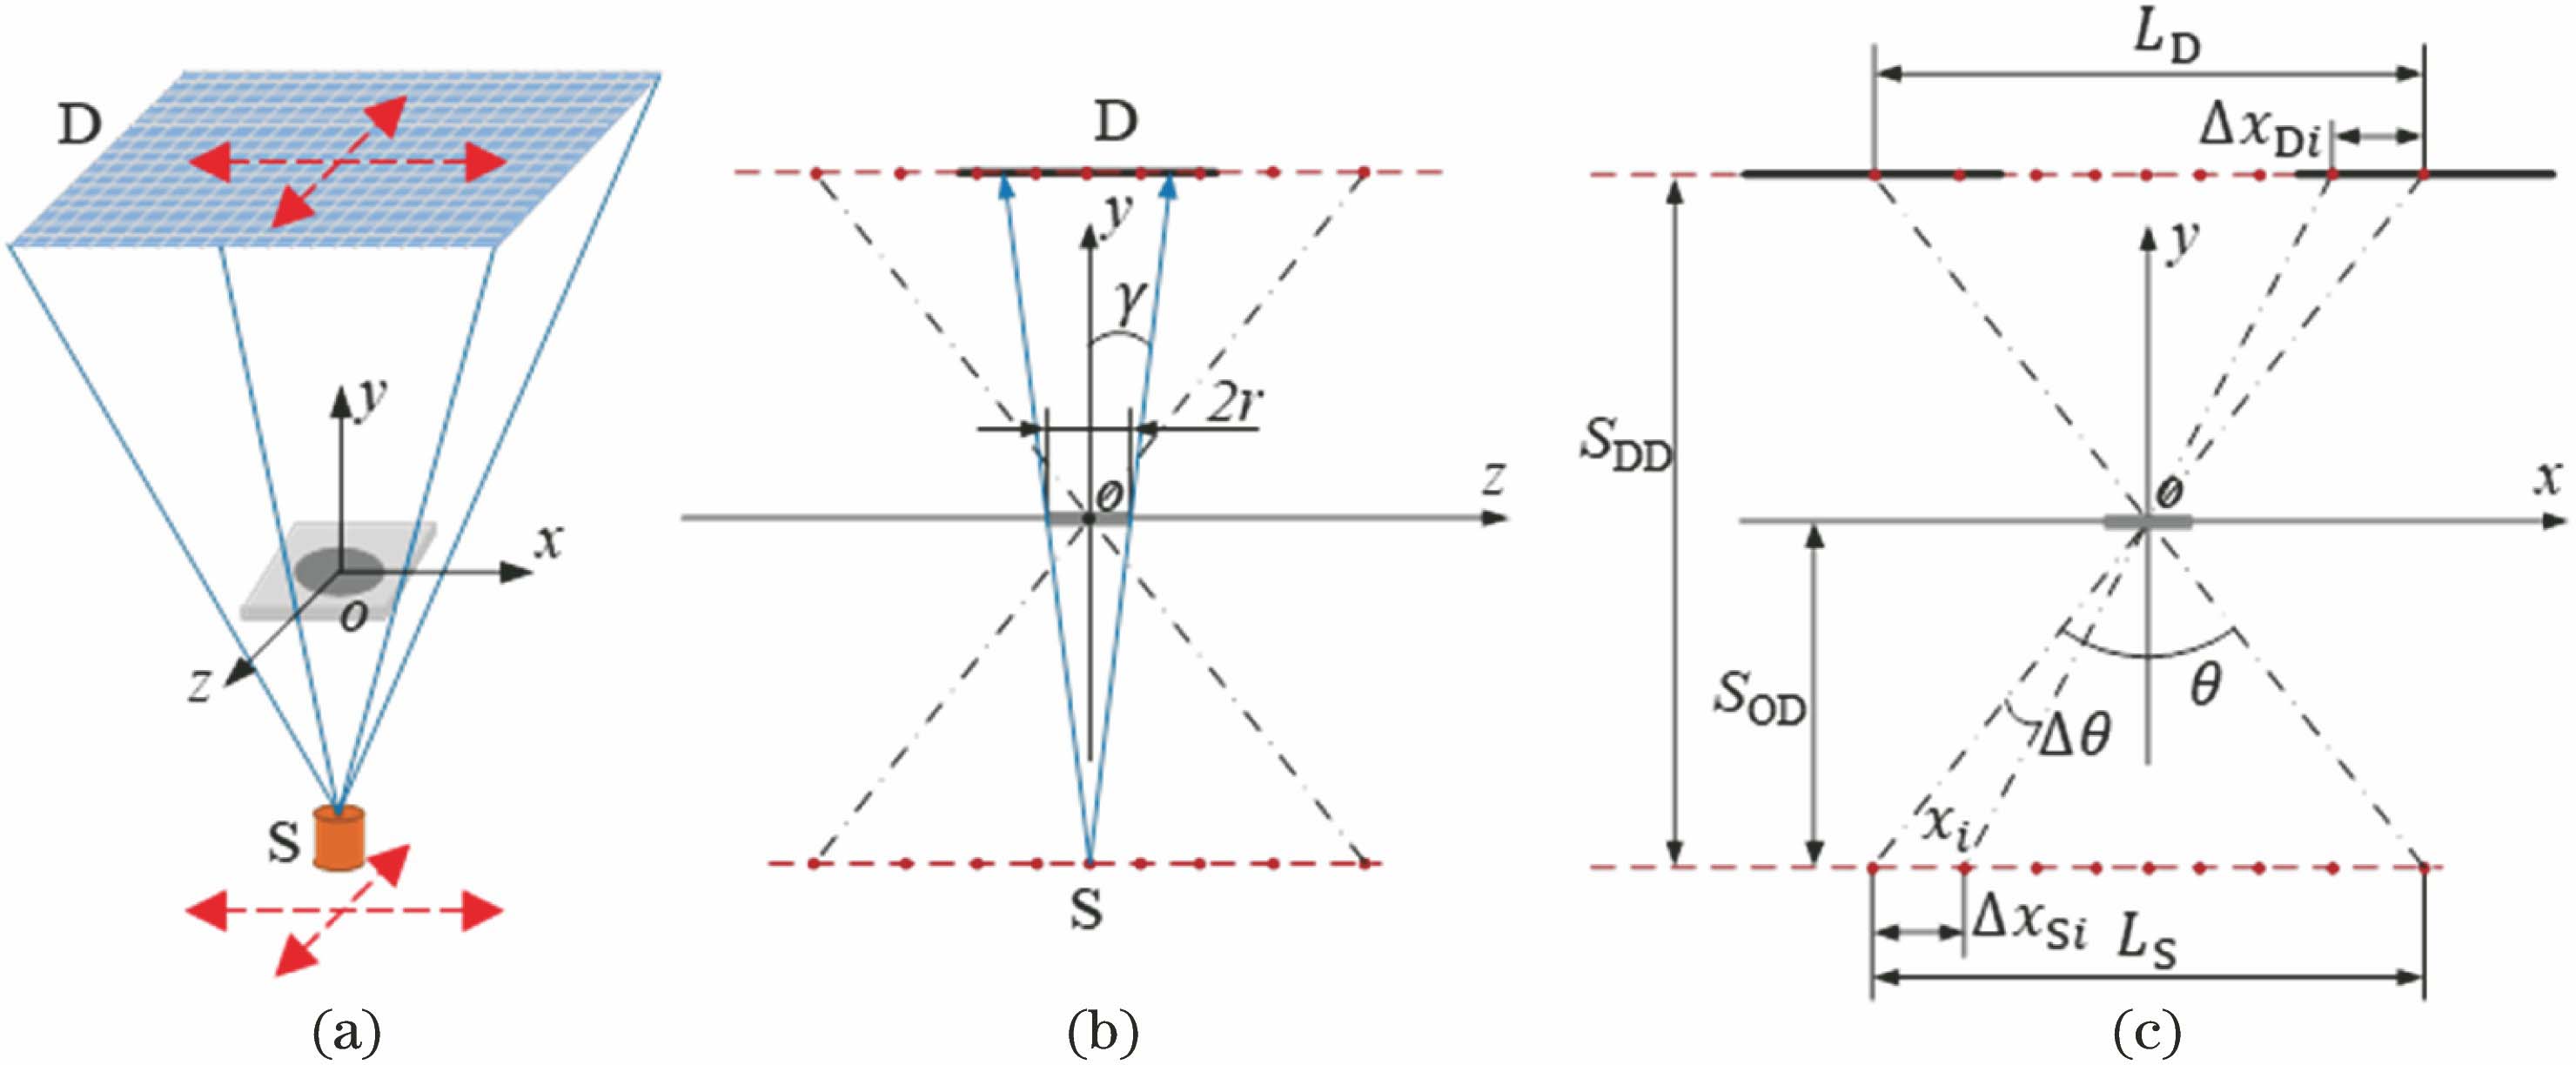
    Fig. 1. Geometric model of OTCL system. (a) 3D scanning model; (b) scanning model in z direction; (c) scanning model in x direction
    Simulation phantom
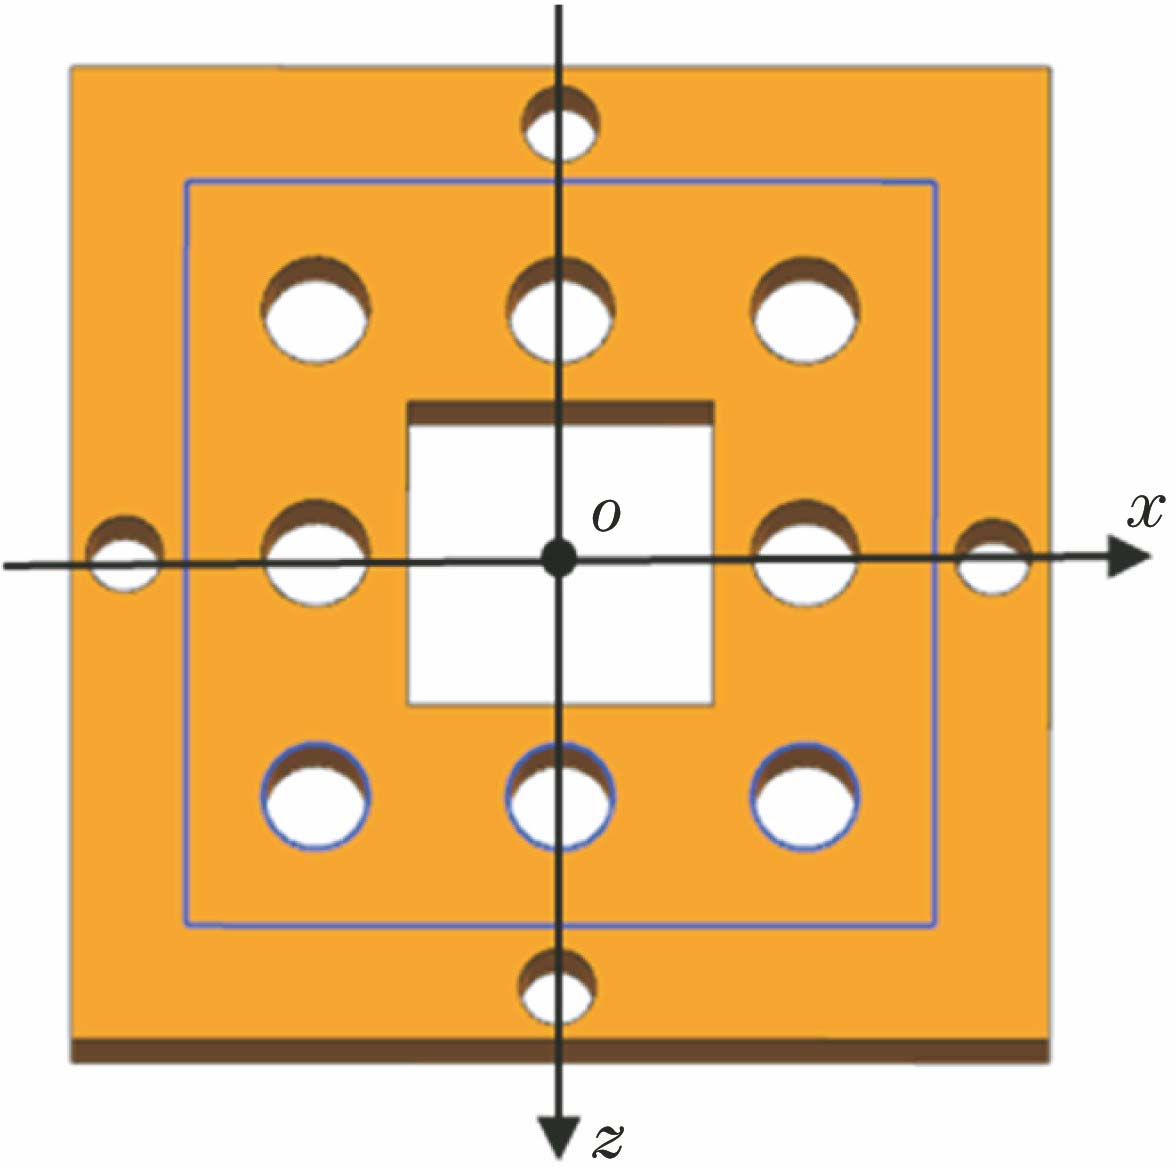
    Fig. 2. Simulation phantom
    31st slice of global reconstruction images using cone-beam. (a) Original image; (b)-(e) results of OTCL; (f)-(i) results of PTCL
    Fig. 3. 31st slice of global reconstruction images using cone-beam. (a) Original image; (b)-(e) results of OTCL; (f)-(i) results of PTCL
    Central profiles of the 31st slice of global reconstruction images obtained by OTCL and PTCL using cone-beam. (a)(b) OTCL; (c)(d) PTCL
    Fig. 4. Central profiles of the 31st slice of global reconstruction images obtained by OTCL and PTCL using cone-beam. (a)(b) OTCL; (c)(d) PTCL
    29th slice of partial reconstructed images obtained by CL imaging using cone-beam. (a) Original image; (b)-(e) OTCL; (f)-(i) PTCL
    Fig. 5. 29th slice of partial reconstructed images obtained by CL imaging using cone-beam. (a) Original image; (b)-(e) OTCL; (f)-(i) PTCL
    Central profiles of the 29th slice of cone-beam partial reconstruction images obtained by OTCL and PTCL. (a)(b) OTCL; (c)(d) PTCL
    Fig. 6. Central profiles of the 29th slice of cone-beam partial reconstruction images obtained by OTCL and PTCL. (a)(b) OTCL; (c)(d) PTCL
    System framework diagram
    Fig. 7. System framework diagram
    Experimental system. (a) Three-dimensional model; (b) photograph of system
    Fig. 8. Experimental system. (a) Three-dimensional model; (b) photograph of system
    PCB of detected object
    Fig. 9. PCB of detected object
    Results of 96th slice of global reconstruction image. (a)(b) Using OTCL; (c)(d) using PTCL
    Fig. 10. Results of 96th slice of global reconstruction image. (a)(b) Using OTCL; (c)(d) using PTCL
    Results of 94th slice of partial reconstruction image. (a)(b) Using OTCL; (c)(d) using PTCL
    Fig. 11. Results of 94th slice of partial reconstruction image. (a)(b) Using OTCL; (c)(d) using PTCL
    ParameterSetting
    Distance from source to detector SDD /mm384.31
    Distance from source to object SOD /mm164.71
    Size of detector array /(pixel×pixel)512×512
    Pixel size /(mm×mm)0.085×0.085
    Number of projections per scan101
    Translation modeEqui-angular
    Size of reconstruction matrix256×256×64
    Iterations50
    Table 1. Setting of simulation parameters of global reconstruction
    Angle /(°)306090120
    OTCL171623026
    PTCL234161128101
    Table 2. MSE obtained by different methods for different angles10-4
    ParameterSetting
    Distance from source to detector SDD /mm392.16
    Distance from source to object SOD /mm117.65
    Size of detector array /(pixel×pixel)512×512
    Pixel size /(mm×mm)0.085×0.085
    Number of projections per scan101
    Translation modeEqui-angular
    Size of reconstruction matrix256×256×64
    Iterations50
    Table 3. Simulation parameters of partial reconstruction
    Angle /(°)306090120
    OTCL /10-62.991.230.710.48
    PTCL /10-64.032.732.261.74
    Table 4. MSE of OTCL and PTCL for different scanning angles
    ParameterSetting
    Distance from source to detector SDD /mm224
    Distance from source to object SOD /mm46
    Size of detector array /(pixel×pixel)1536×1536
    Pixel size /(mm×mm)0.085×0.085
    Number of projections per scan101
    Translation modeEqui-angular
    Size of reconstruction matrix256×256×64
    Graduation angle 1 /(°)40
    Graduation angle 2 /(°)80
    Table 5. Scanning parameters
    Zhongjian Tian, Haijun Yu, Linbo Wang, Zhenzhen Pi, Fenglin Liu. Orthogonal Translation Computed Laminography[J]. Acta Optica Sinica, 2020, 40(22): 2211002
    Download Citation