
Alicia Petronela Rambu, Alin Marian Apetrei, Florent Doutre, Hervé Tronche, Vasile Tiron, Marc de Micheli, Sorin Tascu. Lithium niobate waveguides with high-index contrast and preserved nonlinearity fabricated by a high vacuum vapor-phase proton exchange[J]. Photonics Research, 2020, 8(1): 8
- Photonics Research
- Vol. 8, Issue 1, 8 (2020)
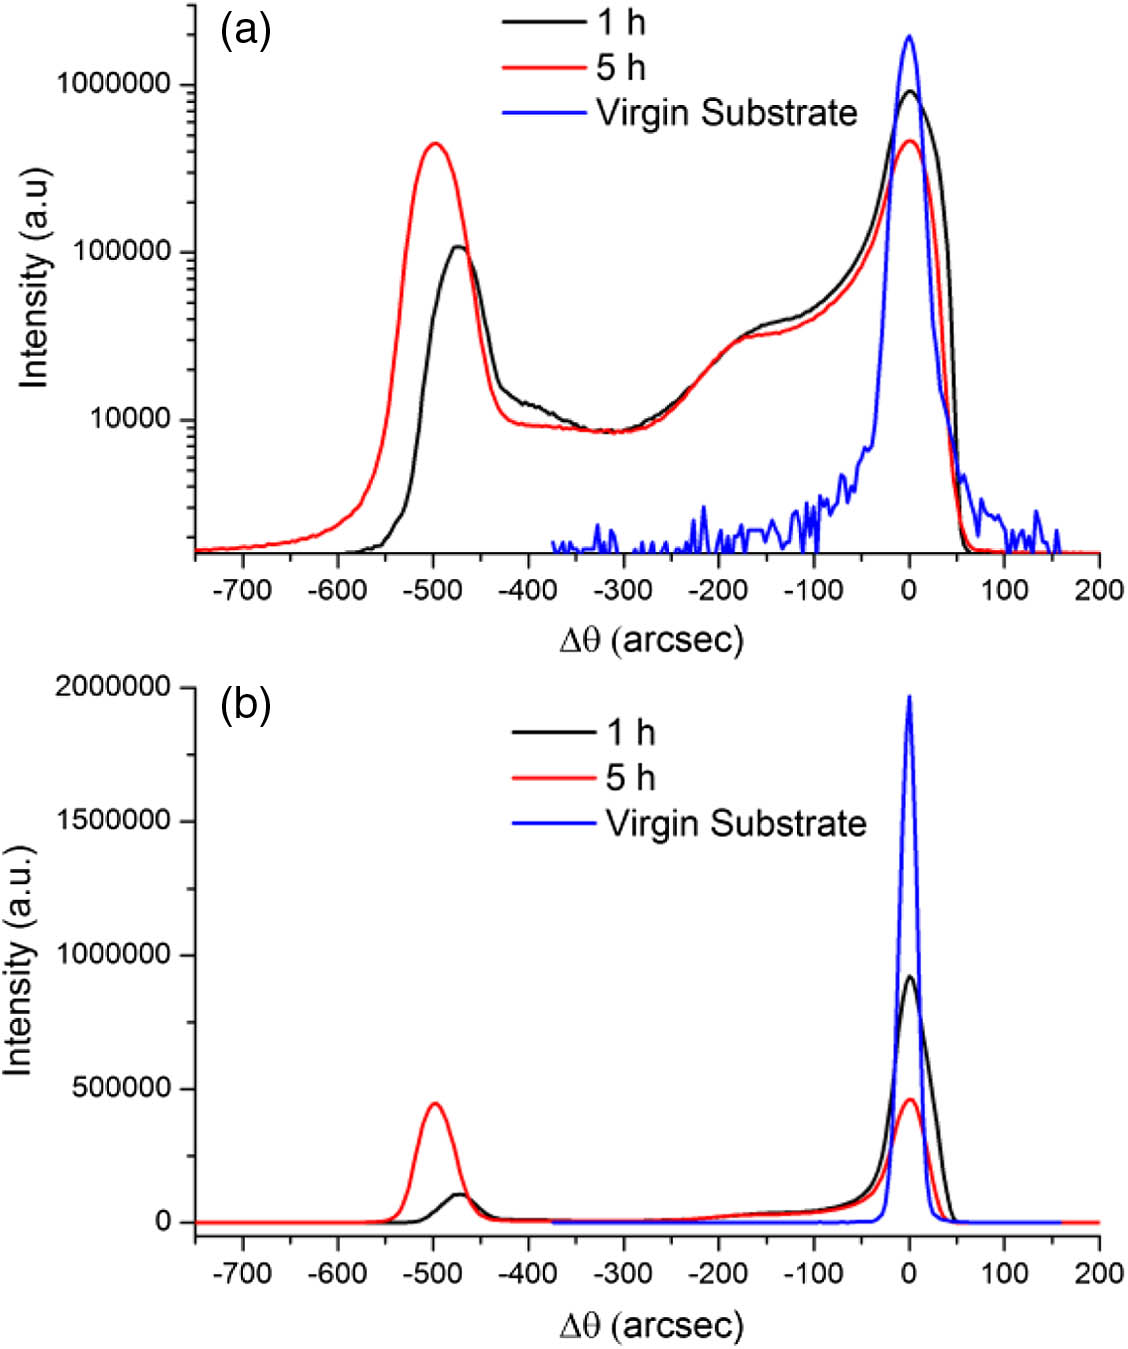
Fig. 1. X-ray rocking curves from (00.12) reflection of Z-cut HiVac-VPE planar waveguides: (a) logarithmic-type representation of vertical scale and (b) linear-type representation of vertical scale. The waveguides were fabricated with different exchange periods t ( h ) T = 350 ° C
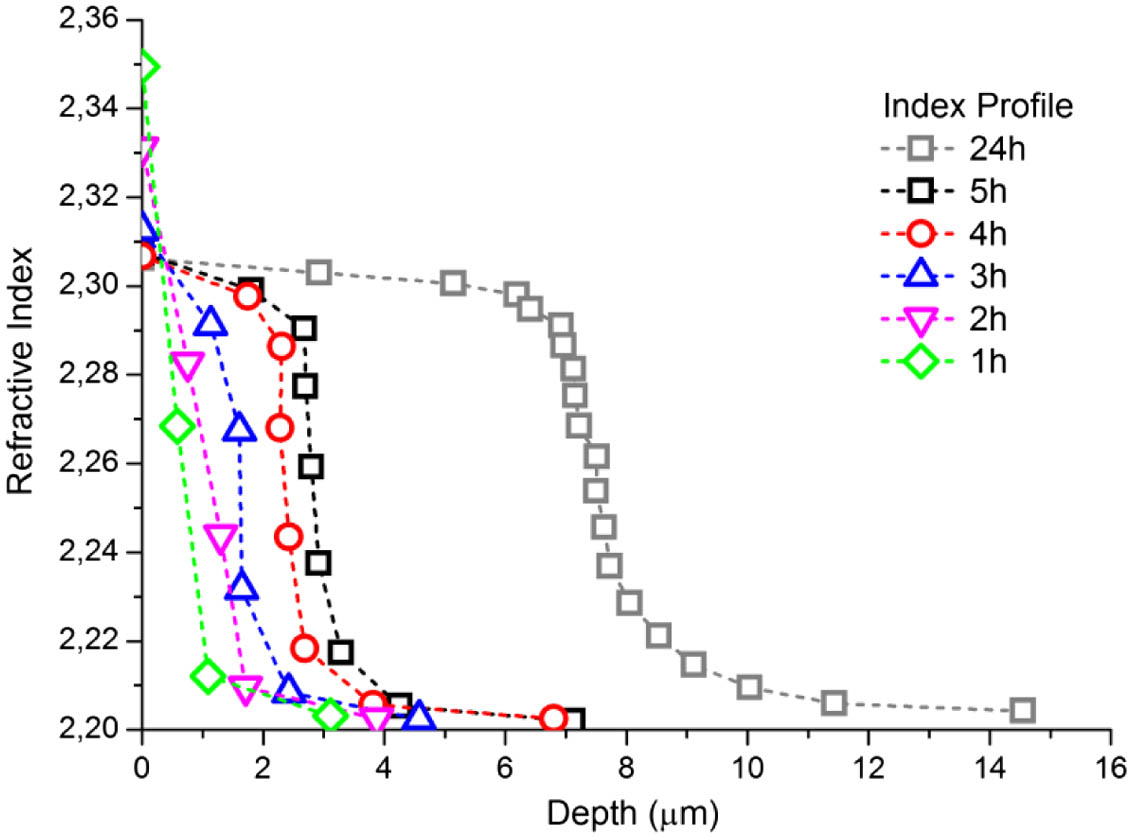
Fig. 2. Extraordinary refractive index profile at λ = 633 nm N eff
Fig. 3. Corrected refractive index profiles at λ = 633 nm t = 24 h N eff
Fig. 4. Top: index profiles of Z-cut HiVac-VPE waveguides fabricated for different exchange durations. The symbols represent the measured N eff 1 ). Bottom: derivative of the fits. Inset: sub-layers structures of the waveguides. The intensity of the red color suggests the refractive index value in the waveguides.
Fig. 5. SHG profiles and reflected fundamental signal of Z-cut HiVac-VPE waveguides superimposed with index profiles (region in gray color) for (a) t = 1 h t = 5 h
Fig. 6. Near-field imaging of the modes at the output of channel waveguides fabricated at T = 350 ° C
Fig. 7. Near-field imaging of the modes at the output of channel waveguides fabricated at T = 350 ° C
Fig. 8. Far-field picture on a screen of TE-polarized hybrid modes in HiVac-VPE channel waveguide at λ = 633 nm
|
Table 1. Index Contrast a

Set citation alerts for the article
Please enter your email address
© Copyright 2018-2021 | Chinese Laser Press. All Rights Reserved 沪ICP备15018463号-20