Alicia Petronela Rambu1, Alin Marian Apetrei1, Florent Doutre2, Hervé Tronche2..., Vasile Tiron3, Marc de Micheli2 and Sorin Tascu1,*|Show fewer author(s)
1Research Center on Advanced Materials and Technologies, Science Department, Institute of Interdisciplinary Research, Alexandru Ioan Cuza University of Iasi, 700506 Iasi, Romania
2Université Côte d’Azur, CNRS, Institut de Physique de Nice (INPHYNI), UMR 7010, Nice, France
3Research Department, Faculty of Physics, Alexandru Ioan Cuza University of Iasi, 700506 Iasi, Romania
Alicia Petronela Rambu, Alin Marian Apetrei, Florent Doutre, Hervé Tronche, Vasile Tiron, Marc de Micheli, Sorin Tascu, "Lithium niobate waveguides with high-index contrast and preserved nonlinearity fabricated by a high vacuum vapor-phase proton exchange," Photonics Res. 8, 8 (2020)
Copy Citation Text
Highly confining waveguides () without a degraded nonlinear coefficient and low propagation losses have been fabricated in lithium niobate (LN) by a new process that we called high vacuum vapor-phase proton exchange (HiVac-VPE). Index contrast, index profile, nonlinearity, and crystallographic phases are carefully investigated. Original analysis of index profiles indicates that the waveguides contain sub-layers whose depths depend on the exchange durations. Propagation behavior, propagation losses, and second-harmonic generation response of HiVac-VPE channel waveguides are investigated at telecom wavelength. The results recommend HiVac-VPE as a very promising technique for fabricating efficient nonlinear photonic integrated circuits in LN crystals.
1. INTRODUCTION
Due to its excellent electro-optical and nonlinear optical properties, paired with a relative easiness of fabricating waveguides, lithium niobate (LN) crystal is an ideal platform for many integrated optics applications and photonic devices. Up to now, most of the commercially available integrated optics devices or laboratory demonstrators have been based on waveguides fabricated either by Ti-indiffusion [1,2] or by one of the conventional liquid-phase proton exchange techniques, namely annealed proton exchange [3–5], reverse proton exchange [6], or soft proton exchange [7–10]. All these techniques allow fabricating low-loss waveguides with preserved electro-optical and nonlinear properties, but in return lead to low-index contrast typically in the range from to 0.03 [6,7,11]. These values limit the benefit linked to the confinement of the lights in a waveguide. It is important to note that the maximum index contrast allowed by the proton exchange technique is approximately at [12], but most of the waveguides exhibiting such a high-index contrast present a nonlinear coefficient totally degraded [13]. Two other techniques, namely high-index soft proton exchange and high vacuum proton exchange (HiVacPE), allowing the fabrication of channel waveguides that exhibit with almost unmodified nonlinearities have been recently reported [14,15]. These waveguides are most attractive for applications because they exhibit a high-index contrast that is adequate for tight light confinement allowing strong electro-optical and nonlinear optical effects. For now, the only downside of these two techniques is the strain-induced propagation losses in the high-index contrast channel waveguides (). However, given by a high control of the bath acidity due to the drying effect of the high vacuum at the beginning of the process, one of the biggest advantages of the HiVacPE technique is the high stability and reproducibility of optical waveguide features [16]. Moreover, the first integrated optics laboratory demonstrator fabricated by HiVacPE has already been investigated [17].
A very promising technique, namely vapor-phase proton exchange (VPE), showing the possibility of creating high-index-contrast LN or lithium tantalate waveguides with preserved nonlinearity and low losses, was reported in the late 1990s and the beginning of the 2000s [18–26]. However, we lack some useful information about the waveguides fabricated by this technique, e.g., (i) the crystalline structure and the modification of lattice parameters of VPE planar waveguides are not precisely known due to the absence or a poorly chosen representation of X-ray diffraction (XRD) results; (ii) the nonlinearity, which is one of the greatest interests of LN waveguides, was investigated only for 40 nm in-deep layer under the surface of the waveguides [19,21,22] and deeper sub-layers have never been investigated; (iii) the investigations of modal behavior and propagation losses in channel waveguides are completely absent in the literature. Finally, this technique has shown also some difficulties in controlling the depth of the waveguides [14,27,28]. As consequence, no further works and no functional optical device have been realized using VPE waveguides since the first aforementioned reports on this technique.
We previously demonstrated that the exchange process (in liquid bath) performed in a hermetically sealed hourglass tube at very low pressure, in order to diminish as much as possible any traces of water from the acid powders, leads to a new and very reproducible behavior in terms of index contrast, shape of index profile, nonlinearity, waveguide depth, etc. [15,16].
Sign up for Photonics Research TOC. Get the latest issue of Photonics Research delivered right to you!Sign up now
Therefore, in this paper, we present our work on the influence of the high vacuum drying effect on the crystallographic parameters, optical features, and quality of both planar and channel waveguides fabricated in benzoic acid vapor. We will call this process HiVac-VPE for high vacuum vapor-phase proton exchange. Our approach has allowed us to achieve very interesting results that have not yet been reported and also to compensate for the lack of information on the optical features of the fabricated waveguides by the vapor phase method. The impact of high vacuum on the optical features of the waveguides and reproducibility of the process was tested over one year and a half by producing, in the same vacuum conditions, more than 50 waveguides. In our study, both planar and channel waveguides have been fabricated and investigated. Over the time, no significant difference has been identified no matter whether it is about index profile behavior, index contrast, nonlinearity, or propagation losses. In addition, no aging phenomenon in the fabricated waveguides has been observed. We can say that HiVac-VPE is a trouble-free and highly reproducible process allowing producing efficient and compact devices for applications in modern photonics.
In Section 2 we will detail the HiVac-VPE fabrication process. Sections 3 and 4 will be devoted to the crystallographic and index profiles investigations, respectively. In Section 5 we will present an original and more precise analysis of index profiles and refractive index sub-layer depths of the protonated substrate. The nonlinearities on planar waveguides (which can be extrapolated to any waveguide shape) are presented in Section 6. Section 7 will deal with the characterization of channel waveguides, essential for the fabrication of efficient photonic circuits. Finally, we will present our conclusion and perspectives.
2. FABRICATION OF WAVEGUIDES
The HiVac-VPE process was performed on Z-cut LN samples cut from 3 in. optical grade wafers (supplied by Gooch & Housego) in a hermetically sealed hourglass tube for different exchange durations . Prior to being sealed, the bottom part of the tube was filled with 16 g of pure benzoic acid (BA) powder (supplied by Sigma-Aldrich) as the vapor source. The sample to be processed is placed in the top part of the tube and then, by using a turbo pumping station (HiCube 80 Eco equipped with a compact full range gauge PKR 251–Pfeiffer), the tube is pumped down to a pressure as low as . Depending on the room conditions and adsorbed humidity by the BA powder before starting of the process, this pressure is reached after pumping times ranging between 1 and 1.5 h. This very low pressure is times lower compared to the first report on vapor phase exchange [18] and times lower compared to the ones reported by the literature for liquid phase exchange [14] and is imperative in order to diminish as much as possible any traces of water from the acid powder.
After the glass tube is sealed, it is placed into a metallic tube container ensuring a uniform heating and an easy and safe manipulation. The metallic tube is placed vertically in an oven preheated at 350°C, which is the exchange temperature. As the temperature of the tube increases, the acid melts and boils at 122°C and 250°C, respectively. After 30 min the acid vapor and the sample have reached the thermal equilibrium at the exchange temperature. From this moment we start counting the proton exchange duration . The bottleneck of the hourglass tube allows the sample to be separated from the liquid acid and to be exposed only to its vapor. The vapor pressure inside the glass tube is constant and depends only on the exchange temperature as long as the acid is always in the liquid–vapor equilibrium at constant volume. Given the amount of acid, we can consider that the proton source is constant during the exchange process. At the end of the exchange duration the tube is cooled down to room temperature. The samples fabrication by the HiVac-VPE process does not suppose any annealing or heat treatment after the vapor proton exchange process itself. Using this protocol, we fabricated planar and channel HiVac-VPE waveguides.
3. CRYSTALLOGRAPHIC CHARACTERIZATION BY X-RAY DIFFRACTION
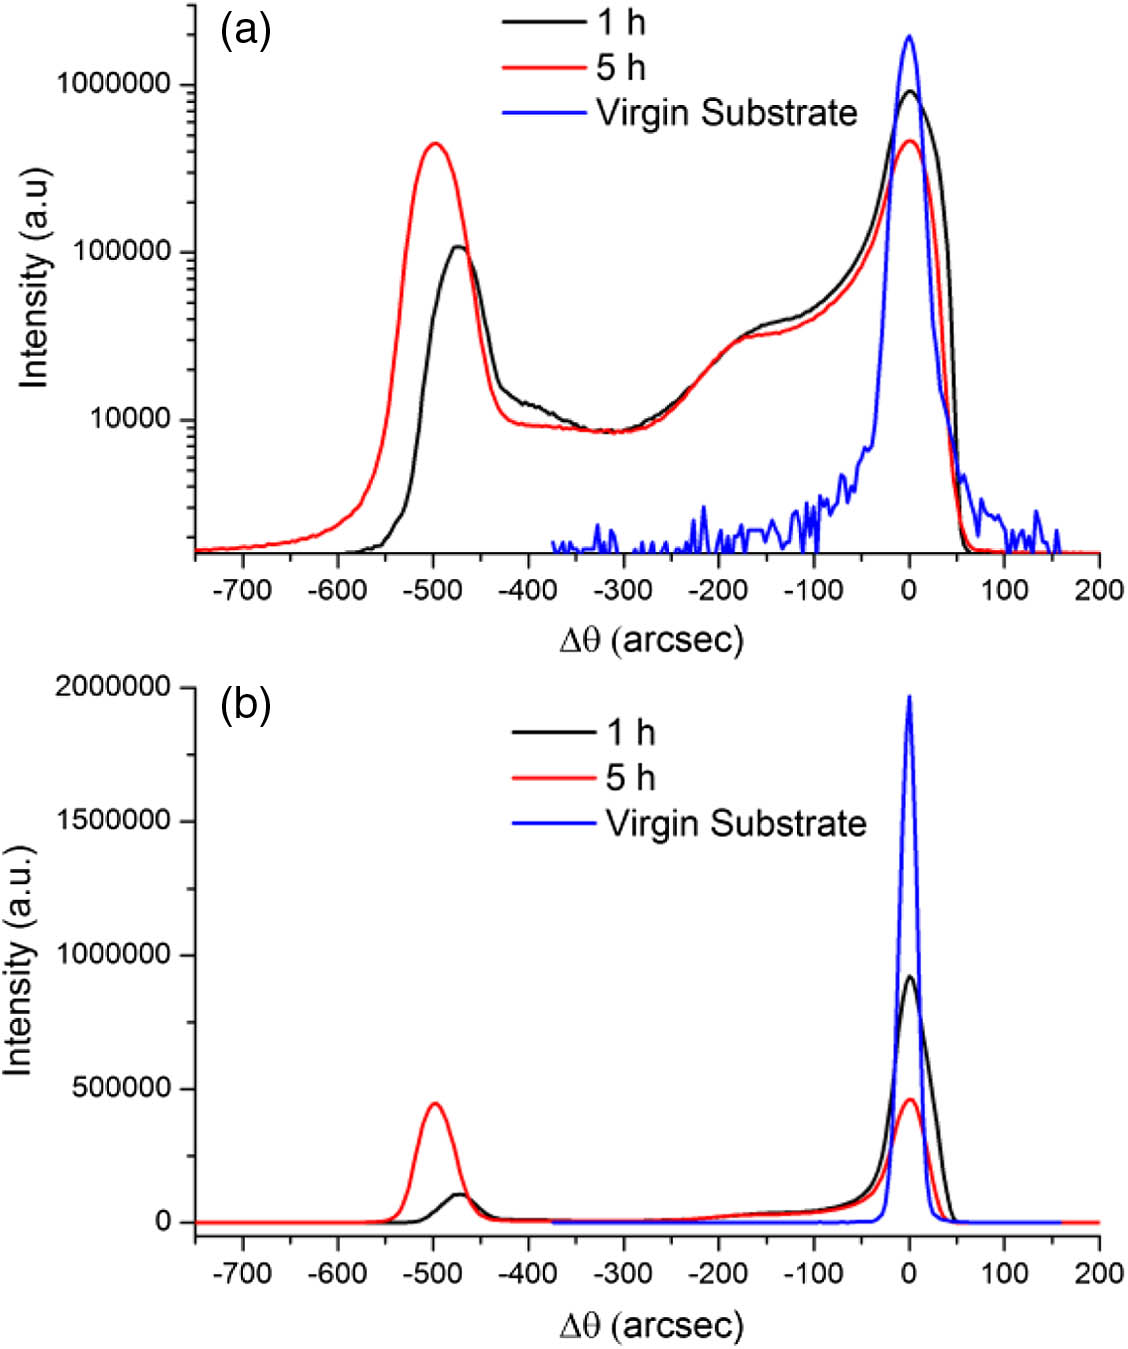
To investigate the crystalline structure and the modification of lattice parameters of HiVac-VPE planar waveguides, we used the XRD method. We chose to use the rocking curves of crystallographic planes parallel to the surface of Z-cut LN samples with Miller indices , , (00.12) corresponding to Bragg angle in the substrate. This value is used as origin in the spectra reported in Fig. 1. It is worth noting that the lattice parameters of the proton exchanged layer are greater than those of the substrate [29]. In the case of a planar waveguide and considering the stress induced by the nonprotonated substrate, the only allowed deformations are normal to the surface of the sample [30]. The strain perpendicular to the surface can be obtained directly from the rocking curves. It is expressed as , where is the measured angular distance between the substrate peak and the protonated layer peak on the rocking curve from the surface plane (), in our case (00.12). It was demonstrated that the surface layer always presents the largest value of the strain [30]. Starting from the rocking curves we identify the crystallographic phases and also calculate the values of the strain and compare them to those reported in the literature [20,21,25,30,31].
Figure 1.X-ray rocking curves from (00.12) reflection of Z-cut HiVac-VPE planar waveguides: (a) logarithmic-type representation of vertical scale and (b) linear-type representation of vertical scale. The waveguides were fabricated with different exchange periods at .
We present the rocking curves for the virgin substrate and the samples protonated for 1 h and 5 h, respectively. For the other samples the rocking curves shapes are located between these two samples. For an accurate comparison between our results and those already presented in the literature, we give the rocking curves in both logarithmic and linear scales.
As shown in Fig. 1, the HiVac-VPE waveguides present interesting crystallographic structures and exhibit characteristics that are worth noting. The -phase is identified in all protonated samples and the maximum intensity peak of this phase is ranging from in the sample protonated for 1 h to in the sample protonated for 5 h, respectively. Therefore, the -phase peaks seat near the one of the substrate and the crystallographic parameters vary gradually and remain similar to those of the substrate. This almost imperceptible shift (only ) of -phase peaks is easily visible only in the logarithmic representation depicted in Fig. 1(a). This fact was not presented in the previously reported works because of the use of linear representations of the spectra like in Fig. 1(b). Also, we clearly observe a sharp peak with its maximum at in the sample protonated for 1 h. This peak corresponds to the -phase. For protonation during 5 h the -phase peak becomes more intense and shifts its maximum value to . The -phase peak intensity increase means a thickening of this layer at the surface of the sample. The bandwidth of the peak is close to the one of the substrate proving the high crystalline quality of the -phase layer.
It is worth noting that for all samples, the XRD signal does not go to zero between the - and -phase peaks.
We clearly observe in log scale, as depicted in Fig. 1(a), a large plateau around which means that the transition between the - and -phase is an inhomogeneous layer with disordered crystalline structure where the crystallographic parameter varies gradually. This layer most likely contributes to relax the lattice parameters mismatch between the -phase layer and the -phase layer and substrate. Note that for similar exchange durations and temperature conditions as in our experiments, previous works report the occurring of -phase in waveguides fabricated by VPE in Z-cut LN [19]. In our experiments, the XRD study did not reveal any -phase thanks to the drying effect of the high vacuum conditions. As previously demonstrated, diminishing as much as possible the water traces in the glass tube involves lower hydrogen and hydroxyl ion concentrations from dissociated water in the benzoic acid vapor [16]. As a consequence, the acidity of the vapor in the glass tube of our experiments is lower than that of the reported works.
In the following sections, we will see how the crystalline structure and the modification of lattice parameters are correlated to index profiles, nonlinearity, and propagation losses exhibited by the waveguides.
4. M-LINES MEASUREMENTS: RECONSTRUCTION OF INDEX PROFILES
In order to reconstruct the index profile of the planar waveguides whose crystalline structures have been presented, the effective indices of the propagation modes have been measured using a standard two-prisms coupling setup and a He–Ne laser emitting at [32]. The light was in-coupled and out-coupled using rutile () prisms pressed against the waveguide surface. At the output of the out-coupling prism, bright lines are observed and for each one the angle with the normal to the prism output surface is measured using an autocollimator (relative error on the angle is less than ). This angle characterizes the propagation constant of the wave associated with the guided mode and thus we can determine the effective index of each guided mode for a given waveguide. From the full set of values of of a given waveguide, one can reconstruct its index profile using the Invers Wentzel–Kramers–Brillouin (IWKB) numerical method described in Ref. [33]. The measured effective indices of TM guided modes at as well as the raw values of mode depths and surface index calculated by IWKB allow us to reconstruct the raw index profiles of waveguides fabricated for different exchange durations by HiVac-VPE. As we can see in Fig. 2, it seems that the index profiles change from an exponentially decreasing one to a mix of a step and a gradient profiles. The change from one regime to the other occurs between and . The exchange duration seems to be the threshold from which the index profile exhibits a step part which can be observed up to and beyond. Note that for and an abrupt jump is observed for the surface index.
Figure 2.Extraordinary refractive index profile at reconstructed by IWKB for planar waveguides fabricated in Z-cut LN by HiVac-VPE at 350°C with different exchange durations. The symbols represent the measured of the propagating modes, except those on the ordinate that represent the raw surface indices calculated by IWKB. Dashed lines are guides for the eye.
It is worth noting the fact that propagation optical modes have also been identified in waveguides fabricated for exchange durations less than 1 h, but the number of modes (one or two) at makes it no longer possible to use the IWKB method.
This interpretation of the shape of index profiles and surface index value should be carefully considered because the IWKB method is inaccurate when the number of guided modes is small, or an abrupt index change occurs in less than an optical wavelength. This drawback of the IWKB method can be overcome and the index profiles can be corrected. Before proceeding to do this some facts have to be highlighted. It is well known that the surface index of the waveguides fabricated by dipping the sample in acid melts depends only on the acidity of the proton source and not on the exchange duration (for long enough exchange durations, i.e., few hours). For the same acidity but different exchange durations the waveguide depth is the only difference between such fabricated waveguides. We assume that in the case of vapor-phase exchange the same thing happens. Therefore, as stated in Section 2, once the liquid–vapor equilibrium is reached, the proton source is constant. So, for a long enough HiVac-VPE process (i.e., ) the fabricated waveguides exhibit the saturated value of the surface index. In addition, the advantage of a very deep waveguide is that it supports many more optical modes compared to the waveguides fabricated for short exchange durations (i.e., 1 h–5 h). As a result, the IWKB method becomes more accurate when calculating the surface index value of a deep waveguide. In this way, the surface index value of the waveguide fabricated for 24 h exchange time will serve as the maximum value that can be obtained by HiVac-VPE. For all other exchange durations (less than 24 h), the values of the surface index can be at most equal to the maximum value but can never exceed this. With these considerations we start to correct the index profiles.
The correction supposes the use of a similar approach to the IWKB method but imposes the limit for the index surface value. So, starting from the experimentally measured effective indices , the correction supposes the modification of their calculated depths in order to obtain a surface index that can be at most equal to the maximum value (for 24 h) and can never exceed this. Note that we will consider only the mathematical solutions with physical meaning, i.e., the value of corrected depth of the mode can never be greater than that of the mode and the value of the surface index of the waveguide fabricated for the exchange duration can never be greater than that for the duration . By doing so, the measured effective indices of TM guided modes at as well as the corrected mode depths and corrected surface index allow us to reconstruct the corrected index profiles of waveguides fabricated for different exchange durations by HiVac-VPE. Thus, the corrected index profiles of the waveguides fabricated for exchange durations in the range of 1 h–5 h as well as the IWKB raw index profile of the waveguide fabricated for 24 h are presented in Fig. 3.
Figure 3.Corrected refractive index profiles at for planar waveguides fabricated in Z-cut LN by HiVac-VPE at 350°C for different durations. For is the raw index profile. The symbols represent the measured of the propagating modes, except those on the ordinate that represent the corrected surface indices. Solid lines are guides for the eye.
In Table 1 is presented the index contrast of a given waveguide calculated as the difference between its corrected surface index and the value of the extraordinary index of the substrate ( at 632.8 nm and room temperature).
Exchange Duration t(h)
Corrected Surface Index
Index Contrast Δne
1
2.3041
0.1016
2
2.3053
0.1028
3
2.3056
0.1031
4
2.3058
0.1033
5
2.3060
0.1035
24
2.30621
0.10371
Table 1. Index Contrast at of Planar Waveguides Fabricated by the HiVac-VPE Processa
In the next section a thorough analysis of index profiles will be done by using the mathematical method fully described in previously reported work [15].
5. M-LINES MEASUREMENTS: RECONSTRUCTION OF INDEX PROFILES
In this section, by using the method fully described in Ref. [15], we thoroughly analyze the corrected index profiles for 1 h–5 h exchange durations and IWKB index profile for 24 h, respectively. Thus, it determines the best fit for the experimental points depicted in Fig. 3 and extracts the waveguides features. However, the best fit is obtained when a sum of two generalized exponential functions is used. It is expressed by where , , , , , and are adjustable parameters and take different values depending on exchange time, and is the depth of the waveguide. Each generalized exponential function in Eq. (1) describes the behavior of one of the chunks (step and gradient) of the index profiles [15]. In Fig. 4 are plotted index profiles for the Z-cut samples fabricated by HiVac-VPE. The symbols represent the measured of the propagating modes, except the corrected surface indices on the ordinate. The solid lines are the fits obtained by using Eq. (1).
Figure 4.Top: index profiles of Z-cut HiVac-VPE waveguides fabricated for different exchange durations. The symbols represent the measured of the propagating modes, except the IWKB corrected surface indices on the ordinate. The solid lines are the fits obtained by using Eq. (1). Bottom: derivative of the fits. Inset: sub-layers structures of the waveguides. The intensity of the red color suggests the refractive index value in the waveguides.
As it was presented in Ref. [15], useful information can be obtained from derivatives of index profile curves. As we clearly can see in the bottom part of Fig. 4, the derivatives of the fits of index profiles exhibit systematically one minimum point for all fabricated waveguides. These minimum points correspond to a given depth in the waveguide where there is a significant refractive index difference between two layers. Only one minimum point means that the waveguide exhibits two refractive index sub-layers. The first sub-layer starts from the surface of the waveguide and extends, as expected, to an increasing depth depending on the exchange duration until approximately 0.94 μm, 1.19 μm, 1.6 μm, 2.4 μm, 2.86 μm, and 7.6 μm in depth. Then the second sub-layer starts and spreads to the end of the protonated area (see inset in the bottom part of Fig. 4 for two sub-layers configuration of the waveguide).
Note that HiVac-VPE allows to pass the index contrast at at shorter exchanges than what we could find in the literature with a similar exchange temperature (for example, for (see Table 1) versus in Ref. [19]). There is a factor 10 of difference between the index contrast values. Even for long exchange durations the maximum values for index contrast reported by the literature are less than 0.1 at [19,20].
We recall once again that all our results presented above show a very high reproducibility (no significant differences over 50 waveguides processed over one year and a half) never reached before, thanks to the drying effect of high vacuum pumping.
6. NONLINEARITY MEASUREMENTS
One of the great interests of LN waveguides is their high nonlinear efficiency. As we stated in the introductory section, the information about the nonlinearity of VPE waveguides is limited [19,21,22]. In these studies, the incident light beam at 532 nm was directed onto a planar waveguide surface and the reflected second-harmonic signal at 266 nm was measured. This method is fully described in Ref. [13]. Since the wavelength of the second harmonic is strongly absorbed by the waveguide and substrate lattice (absorption edge at 330 nm), only the harmonic generated in the first 40 nm in-deep layer under the waveguide surface goes out of the sample and could be detected. Consequently, this method, by unfortunate choice of fundamental and second-harmonic wavelengths, eliminates second-harmonic generation (SHG) contribution of deeper sub-layers of the waveguide.
In order to overcome the material absorption at UV wavelengths, the nonlinearity of our HiVac-VPE waveguides was probed by a method similar to the surface SHG microscopy [34]. Our experimental setup is fully described in Ref. [35]. A laser beam at wavelength 1550 nm is focused on the polished end facet of a waveguide and vertically scanned through the different regions: air, protonated layers, and substrate, respectively. By measuring, during the scan, the reflected fundamental and second harmonic (SHG) beams, one can qualitatively evaluate the variation of the second-order nonlinearity coefficient induced by the waveguide fabrication process. The fundamental beam is used to identify the air–waveguide interface position, and the intensity of the harmonic is used to compare nonlinearities of the protonated layer and substrate, respectively.
In Fig. 5 are presented typical examples of these scans superimposed with the corresponding index profile at for a Z-cut waveguide fabricated for the exchange duration 1 h and 5 h, respectively. The SHG signal superimposed on the refractive index profile of the waveguide clearly shows an intense peak of SHG in the protonated area. This enhancement of the SHG signal in waveguides compared to the bulk substrate is probably a complex function of the discontinuity of the nonlinear coefficient between the air and the crystal [36] and of the confinement of the pump beam due to the high-index contrast in the step part (first sub-layer) of the waveguide. The higher SHG peak intensity for longer exchange () is due to more pump confinement in the waveguide compared to shorter exchange () waveguides. This is due to the different light in-coupling allowed by the difference of waveguide depths.
Figure 5.SHG profiles and reflected fundamental signal of Z-cut HiVac-VPE waveguides superimposed with index profiles (region in gray color) for (a) and (b) .
Therefore, without a complete understanding of the enhancement of the reflected SHG signal and due to the lateral resolution of the experiment (μ) and the small depth of the -phase layer (0.94 μm to 2.84 μm), it is impossible to extract information about the exact value in HiVac-VPE waveguides. As we clearly see in Fig. 5, the SHG signal value in the waveguide region is always higher than the SHG signal value in the substrate. Therefore, we can assume that the nonlinear coefficient value of the waveguide is at least equal to the substrate value, so there is no degradation of the nonlinear coefficient .
Therefore, by our method, we have shown that nonlinearity, essential for efficient nonlinear applications and devices, is conserved for the whole protonated layer of the waveguides fabricated by HiVac-VPE. In addition, no aging phenomenon in the fabricated waveguides has been observed.
7. INVESTIGATIONS OF CHANNEL WAVEGUIDES
As we mentioned in the introductory section, investigations on channel waveguides fabricated in benzoic acid vapor are completely missing in the literature even if they are paramount elements of modern photonic circuits. In this section, we propose a thorough analysis of HiVac-VPE channel waveguides in order to broaden the knowledge about this kind of structure. In view of integrated optics applications, we have targeted the fabrication of channel waveguides single-mode at . Taking into account the high-index contrast, we have to adjust the width and the depth of the waveguides so that they remain single-mode at the wavelength of interest. By using the fabrication procedure described in Section 2, the channel waveguides were made through a 150 nm thickness mask exhibiting openings of 1 μm, 1.5 μm, and 2 μm widths, respectively. The depth of the waveguides is controlled by the exchange duration, so in this case. The mask was deposited on the surface of the Z-cut sample so the waveguides will support only TM modes through -axis light propagation. Besides the channel waveguides, the so prepared samples have the advantage to exhibit on the opposite surface, a planar waveguide very useful for preliminary characterizations described in previous sections. Given the narrow openings on the mask it is worth noting that (i) the channel waveguides should exhibit smaller depths than the planar waveguide as the kinetics of proton exchange is slower through narrow openings; and (ii) the channel waveguides will probably exhibit larger widths than the mask as the lateral diffusion of protons is no longer negligible through narrow openings [37,38]. Therefore, if more complex waveguiding structures, including bends and tapers, are fabricated by using HiVac-VPE, it is necessary to consider the lateral diffusion of the protons and to adjust the dimensions (widths, lengths, radii, etc.) of the targeted structure.
To allow characterizing the channel waveguides, after the exchange process, the input and the output edges of the samples were polished at optical grade quality. The length of the waveguides after polishing is . The modal behavior was verified by observing the near-field pattern of the propagating mode for each width of the fabricated channel waveguides. The investigations were performed by using a tunable laser (Yenista Optics–Tunics T100R) around . For the in-coupling we used a microlensed polarization-maintaining fiber. The image of the propagating modes at the waveguide output is obtained with a microscope objective and an infrared highly sensitive CCD camera (NIR-300PGE from VDS Vosskühler GmbH).
In the case of waveguides with both 1 μm and 1.5 μm width, respectively, we experimentally validated a single-mode propagation behavior at . In Fig. 6 we present imaging of fundamental modes, as well as mode intensity distribution in width and depth. Figure 6(a) shows the result for waveguides fabricated through a 1 μm silica mask opening. The FWHM measurements of the intensity profile are μ in width and μ in depth. Figure 6(b) presents the result for waveguides fabricated through a 1.5 μm silica mask opening. The FWHM measurements of intensity profile are μ in width and μ in depth.
Figure 6.Near-field imaging of the modes at the output of channel waveguides fabricated at for 1 h through the silica mask with openings of (a) 1 μm and (b) 1.5 μm width, respectively.
In Fig. 7 we present the near-field pattern at of the optical modes supported by a channel waveguide with 2 μm width. As we clearly see, these waveguides exhibit a slightly multimodal propagation. In Fig. 7(a) is an image of the fundamental mode supported by such a waveguide, and in Fig. 6(b) it is seen that both the fundamental mode and the first superior mode are excited.
Figure 7.Near-field imaging of the modes at the output of channel waveguides fabricated at for 1 h through the silica mask with an opening of 2 μm width. (a) Fundamental mode and (b) superior mode + fundamental.
These were the only modes experimentally observed. So, for 2 μm, the waveguides exhibit a multimode behavior because of the high-index contrast, even for short durations of exchange i.e., for 1 h. It is obvious that the propagation behavior in HiVac-VPE channel waveguides will be largely multimode at for any other combination of waveguide width and exchange duration greater than the investigated ones.
Propagation losses in the HiVac-VPE channel waveguides have been measured by using the Fabry–Perot cavity technique [39]. Because this technique requires single-mode propagation through the waveguides, the measurements were performed only for the waveguides exhibiting 1.5 and 1 μm width, respectively. The best of our investigated channel waveguides exhibit propagation losses of around .
As the planar waveguides on the opposite face of the samples exhibited quite good optical quality during M-lines investigations, not compatible with measured high propagation losses, we suppose the arising of hybrid modes (EH modes) in channel waveguides. Indeed, the complex strain tensor induced by protonation causes TM–TE polarization coupling in the channel waveguides leading to the rise of hybrid modes (EH modes) whose ordinary part radiates in the substrate inducing propagation losses.
These kinds of modes were already observed in proton exchanged Z-cut LN channel waveguides and are definitely related to the important strain induced by the proton exchange process [14,15,40,41]. To check this hypothesis, we observed the far field at the output of the channel waveguide by using a visible light at . In order to separate TM and TE polarizations, a polarizer was introduced between the sample and the screen placed just a few centimeters away. When only TE polarization is passing, on images in Fig. 8 the characteristic semicircles corresponding to the light radiating into the substrate, the channel waveguide acting like an antenna, can be observed. A part of the radiating light is reflected by the bottom surface of the sample, resulting in mirrored semicircles in the upper half of the images in Fig. 8.
Figure 8.Far-field picture on a screen of TE-polarized hybrid modes in HiVac-VPE channel waveguide at for (a) 1 μm width and (b) 1.5 μm width, respectively.
These EH modes are not observed in planar Z-cut LN waveguides during M-lines measurements because in this case the strains and stresses induced by the exchange process do not modify the symmetry of the crystal and no TE–TM coupling occurs. Contrariwise, in the channel waveguides, where the strains and stresses are induced by the presence of the nonmodified crystal under and on the sides of the waveguide, this one becomes biaxial, thereby generating EH modes. Therefore, it is clear that the mechanism responsible for propagation losses in channel HiVac-VPE waveguides is the occurrence of hybrid modes caused by TM–TE polarization coupling. Note that two scenarios may appear when talking about EH modes. First, if the effective index of an EH mode is higher than ordinary index of LN it propagates like a pure TM mode, and its ordinary component has an insignificant role. Second, if of an EH mode is lower than of LN, then the ordinary component of the mode radiates into the substrate. As we experimentally validated, the second one has occurred in our case.
6. DISCUSSION AND CONCLUSIONS
In this work, we took advantage of the fact that, using the drying effect of the high vacuum at the beginning of the fabrication process, the waveguides fabricated by vapor proton exchange at 350°C simultaneously exhibit strong confinement, preserved nonlinearities, and most important high reproducibility of their optical features and geometrical parameters. If the main purpose was to improve the reproducibility and the quality of the produced waveguides by limiting and controlling the water traces in the glass tube, we discovered that the high vacuum involves new behaviors and results. The impact of high vacuum on the fabrication reproducibility was tested by producing in similar conditions more than 50 waveguides during one year and a half and no notable differences were identified. In addition, no aging phenomenon in the fabricated waveguides has been observed for a year.
From a crystallographic point of view all investigated samples exhibit only and crystallographic phases.
Regarding the optical features of the HiVac-VPE waveguides we discovered very interesting behaviors. For example, the high-index contrast is obtained for relatively short exchange durations (). The index profile is a mix of a step and a gradient for all investigated samples. From derivatives of the index profiles fits, we showed that the HiVac-VPE waveguides exhibit two refractive index sub-layers, with the depth of the first one depending on the exchange duration.
Concerning the nonlinearity of HiVac-VPE waveguides, they were probed for the whole in-deep protonated layers, leading to the conclusion that the nonlinearities are at least equal to the one of the substrate.
Finally, for the first time as far as we know, we investigated the modal behavior and propagation losses of channel waveguides fabricated in acid vapor at the telecom wavelength. Single-mode propagations at telecom wavelengths were obtained for channel waveguides exhibiting 1 and 1.5 μm width and protonated for 1 h. Propagation losses () have been measured by using the Fabry–Perot cavity technique. We showed that these relatively high propagation losses were due to hybrid modes caused by TM–TE polarization coupling in channel waveguides. Future work should be to decrease the propagation losses measured in this work and we introduce here some leads to do so: (i) the fabrication of a planar HiVac-VPE waveguide does not induce lateral stress, and therefore a channel waveguide fabricated afterward using a surface etching of the sample to define ridge channel waveguides should eliminate the arising of EH modes; (ii) the ordinary index of the substrate should be decreased prior to the HiVac-VPE waveguide fabrication. This could be obtained with a deep planar waveguide which exhibits low-index variation. This would not significantly affect the afterward high HiVac-VPE index contrast, while the reduction of should be enough to have the effective index of the fundamental propagating mode in the channel waveguide larger than the ordinary index of the modified substrate, thus preventing propagation losses due to radiation.
In summary, we have demonstrated that intensively pumping the exchange ampoule to diminish as much as possible the water content in the exchange glass tube resulted in a new proton exchange technique, the so-called HiVac-VPE. Taking advantage of simultaneously exhibited index contrast as high as , relatively low propagation losses, and perfect preserved nonlinearity, the HiVac-VPE technique can be a way of improving the efficiency of the nonlinear components and devices in many applications using LN waveguides. In addition, channel waveguides exhibiting high index contrast with preserved nonlinearity allow fabricating nonlinear photonic wires. This is of high interest for nonlinear highly efficient and compact devices for quantum and classical optical data processing.
[27] O. Stepanenko. Towards proton exchanged quantum wires and highly confining integrated circuits on LiNbO3(2013).
[28] L. Chanvillard. Interactions paramétriques guides de grand efficacité: utilisation de l’échange protonique doux sur niobate de lithium inversé périodiquement(1999).
Alicia Petronela Rambu, Alin Marian Apetrei, Florent Doutre, Hervé Tronche, Vasile Tiron, Marc de Micheli, Sorin Tascu, "Lithium niobate waveguides with high-index contrast and preserved nonlinearity fabricated by a high vacuum vapor-phase proton exchange," Photonics Res. 8, 8 (2020)