• Laser & Optoelectronics Progress
  • Vol. 59, Issue 1, 0114007 (2022)
Hailong Shao1、2, Zixiong Lin2, Zheng Zhang2, Yichao Wang2, Ming Shi2, and Wenxiong Lin2、*
Author Affiliations
  • 1College of Chemistry, Fuzhou University, Fuzhou , Fujian 350108, China
  • 2Fujian Institute of Research on the Structure of Matter, Chinese Academy of Sciences, Fuzhou , Fujian 350002, China
  • show less
    DOI: 10.3788/LOP202259.0114007 Cite this Article Set citation alerts
    Hailong Shao, Zixiong Lin, Zheng Zhang, Yichao Wang, Ming Shi, Wenxiong Lin. Selective Laser Melting Process of Titanium Alloy Based on Single-Track Structure and Linear and Volumetric Energy Densities[J]. Laser & Optoelectronics Progress, 2022, 59(1): 0114007 Copy Citation Text show less
    Micromorphology of TC4 titanium alloy powder
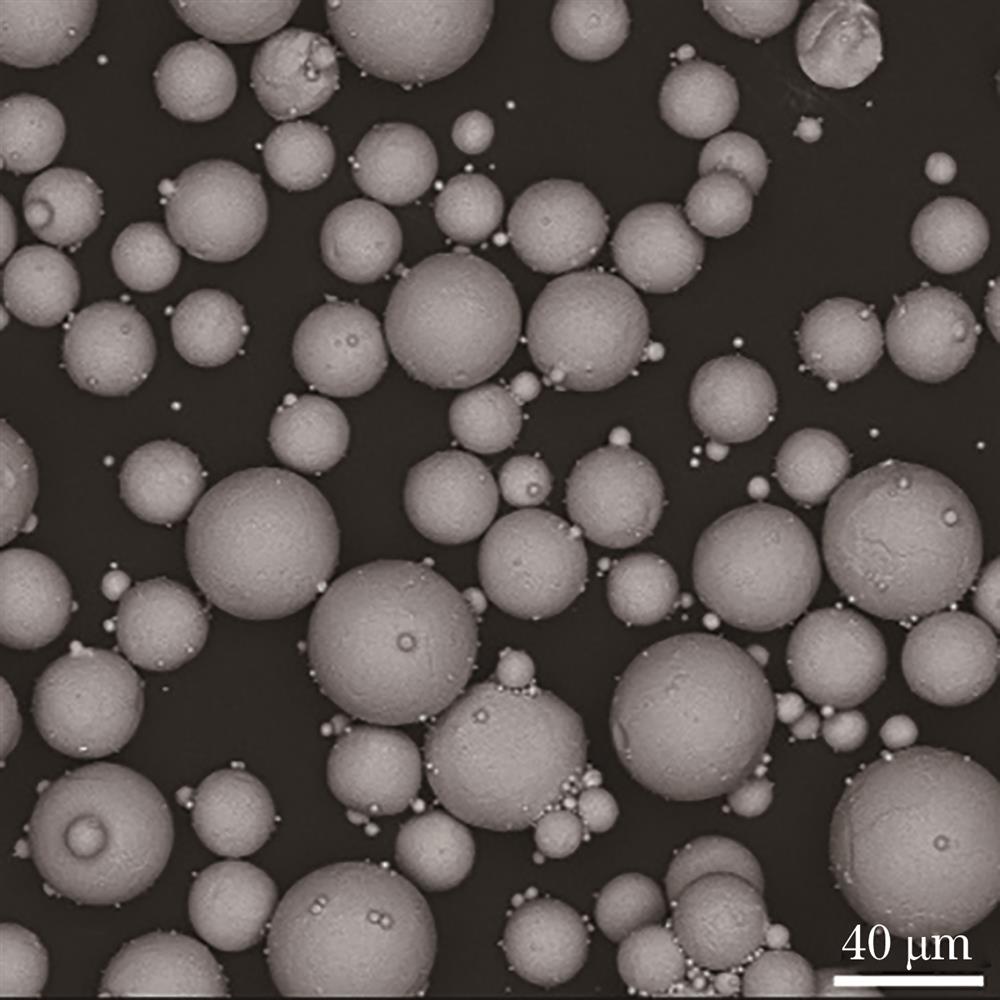
    Fig. 1. Micromorphology of TC4 titanium alloy powder
    Morphologies of single channel with different linear energy densities when layer thickness is 30 μm. (a) ηη≤190 J/m; (c) η>190 J/m
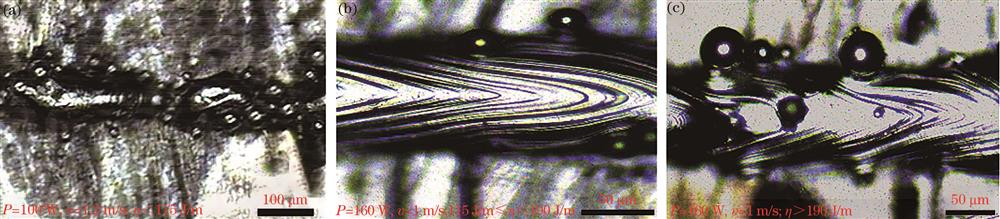
    Fig. 2. Morphologies of single channel with different linear energy densities when layer thickness is 30 μm. (a) η<115 J/m; (b) 115 J/m≤η≤190 J/m; (c) η>190 J/m
    Relationship between molten pool width and laser power when layer thickness is 30 μm
    Fig. 3. Relationship between molten pool width and laser power when layer thickness is 30 μm
    Relationship between width and height of molten pool and linear energy density. (a) Relationship between width and linear energy density; (b) height of molten pool when ηη≤190 J/m; (d) height of molten pool when η>190 J/m
    Fig. 4. Relationship between width and height of molten pool and linear energy density. (a) Relationship between width and linear energy density; (b) height of molten pool when η<115 J/m; (c) height of molten pool when 115 J/m≤η≤190 J/m; (d) height of molten pool when η>190 J/m
    Typical surface morphologies of different samples. (a) No. 1; (b) No. 7; (c) No. 13; (d) No. 25
    Fig. 5. Typical surface morphologies of different samples. (a) No. 1; (b) No. 7; (c) No. 13; (d) No. 25
    SEM images of different samples. (a) No. 1; (b) No. 7; (c) No. 13; (d) No. 25
    Fig. 6. SEM images of different samples. (a) No. 1; (b) No. 7; (c) No. 13; (d) No. 25
    Microstructure and XRD image of No. 7 sample. (a) Microstructure; (b) XRD image
    Fig. 7. Microstructure and XRD image of No. 7 sample. (a) Microstructure; (b) XRD image
    Schematic of powder bed melting process
    Fig. 8. Schematic of powder bed melting process
    Curve of forming thickness changed with number of powder spreading
    Fig. 9. Curve of forming thickness changed with number of powder spreading
    Relationship among linear energy density, surface roughness, and density
    Fig. 10. Relationship among linear energy density, surface roughness, and density
    Relationship among volumetric energy density,surface roughness, and density
    Fig. 11. Relationship among volumetric energy density,surface roughness, and density
    Sample No.PowerP /WScanning speedv /(m·s-1Hatch spaced /mmLinear energy density η /(J·m-1Volumetric energy density E /(J·mm-3
    11300.900.085144.4430.90
    21400.950.085147.3731.52
    31501.000.085150.0032.09
    41601.050.085152.3832.59
    51701.100.085154.5533.06
    61701.050.080161.9036.80
    71601.000.080160.0036.36
    81500.950.080157.8935.89
    91400.900.080155.5635.35
    101301.100.080118.1826.86
    111301.050.075123.8130.01
    121401.000.075140.0033.94
    131501.100.075136.3633.06
    141600.900.075177.7843.10
    151700.950.075178.9543.38
    161700.900.070188.8949.06
    171600.950.070168.4243.75
    181501.050.070142.8637.11
    191401.100.070127.2733.06
    201301.000.070130.0033.77
    211300.950.065136.8438.28
    221401.050.065133.3337.30
    231500.900.065166.6746.62
    241601.100.065145.4540.69
    251701.000.065170.0047.55
    Table 1. Parameters of three-factor-five-level orthogonal experiment (Initial powder thickness: 30 μm)
    Sample No.RoughnessRa /μmDensity ρ /(g·cm-3Sample No.RoughnessRa /μmDensity ρ /(g·cm-3Sample No.RoughnessRa /μmDensity ρ /(g·cm-3
    19.0644.404108.4264.368198.6374.403
    27.3954.386119.6894.396206.5274.390
    37.5154.394129.3154.413217.6874.398
    47.4994.420136.8314.413227.1874.406
    56.1014.416145.9434.404239.9094.411
    64.7994.384155.6114.415245.3324.388
    75.5974.424166.1794.4022510.0284.401
    86.9064.3951710.2914.408
    99.0644.395186.3094.402
    Table 2. Surface roughness and density of samples
    Hailong Shao, Zixiong Lin, Zheng Zhang, Yichao Wang, Ming Shi, Wenxiong Lin. Selective Laser Melting Process of Titanium Alloy Based on Single-Track Structure and Linear and Volumetric Energy Densities[J]. Laser & Optoelectronics Progress, 2022, 59(1): 0114007
    Download Citation