• Laser & Optoelectronics Progress
  • Vol. 59, Issue 6, 0617028 (2022)
Hongxiao Li1, Shu Li2, Xiafei Shi1, Xiaoxi Dong1, Ge Jin2, Lanping Zhu2, Yingxin Li1, and Huijuan Yin1、*
Author Affiliations
  • 1Institute of Biomedical Engineering, Chinese Academy of Medical Sciences & Peking Union Medical College, Tianjin 300192, China
  • 2Department of Gastroenterology, General Hospital of Tianjin Medical University, Tianjin 300050, China
  • show less
    DOI: 10.3788/LOP202259.0617028 Cite this Article Set citation alerts
    Hongxiao Li, Shu Li, Xiafei Shi, Xiaoxi Dong, Ge Jin, Lanping Zhu, Yingxin Li, Huijuan Yin. BiT-Based Early Gastric Cancer Classification Using Endoscopic Images[J]. Laser & Optoelectronics Progress, 2022, 59(6): 0617028 Copy Citation Text show less
    Comparison of four metrics among the models with different backbone networks, the spot size represents the number of trainable parameters of each model. (a) Accuracy; (b) F1-score; (c) sensitivity; (d) specificity
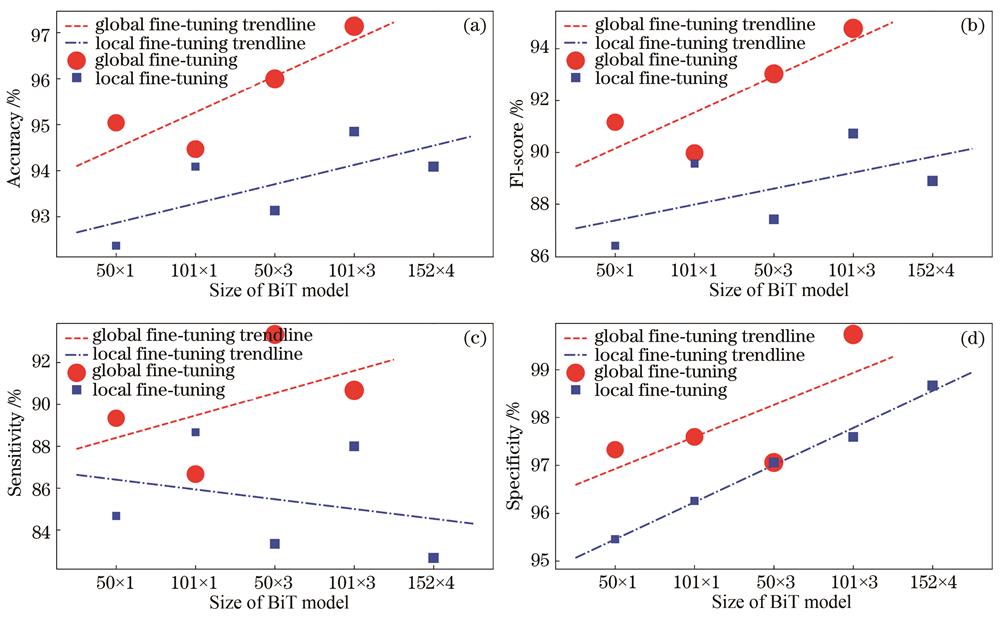
    Fig. 1. Comparison of four metrics among the models with different backbone networks, the spot size represents the number of trainable parameters of each model. (a) Accuracy; (b) F1-score; (c) sensitivity; (d) specificity
    ROC curves and AUC of different models. (a) ROC curves of five models with different untrainable backbone networks; (b) ROC curves of four models with different trainable backbone networks; (c) ROC curves of six models with a trainable 50×1 backbone network under different batchsizes
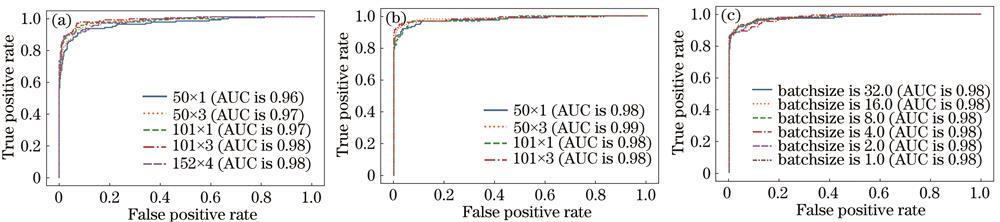
    Fig. 2. ROC curves and AUC of different models. (a) ROC curves of five models with different untrainable backbone networks; (b) ROC curves of four models with different trainable backbone networks; (c) ROC curves of six models with a trainable 50×1 backbone network under different batchsizes
    Confusion matrices of all the models applied on the test set, C represents the cancer label, NC represents the non-cancer label
    Fig. 3. Confusion matrices of all the models applied on the test set, C represents the cancer label, NC represents the non-cancer label
    Examples of testing images
    Fig. 4. Examples of testing images
    Parameter50×1101×150×3101×3152×4
    Batchsize3216844*
    Number of parameters2350445042496578211186370381802178928356610
    Table 1. Batchsizes and parameter amounts of the five BiT backbone networks
    Size of backbone networkTrainable stateAccuracy /%Sensitivity /%Specificity /%F1-score /%
    50×1TRUE95.0489.3397.3391.16
    50×1FALSE92.3784.6795.4586.39
    101×1TRUE94.4786.6797.5989.97
    101×1FALSE94.0888.6796.2689.56
    50×3TRUE95.9993.3397.0693.02
    50×3FALSE93.1383.3397.0687.41
    101×3TRUE97.1490.6799.7394.77
    101×3FALSE94.8588.0097.5990.72
    152×4FALSE94.0882.6798.6688.89
    Table 2. Testing metrics of the models with different backbone networks on test set
    BatchsizeAccuracy /%Sensitivity /%Specificity /%F1-score /%
    3295.0489.3397.3391.16
    1695.2389.3397.5991.47
    895.2390.0097.3391.53
    493.8989.3395.7289.33
    295.2388.6797.8691.41
    195.4290.0097.5991.84
    Table 3. Four metrics of the six models with a trainable 50×1 backbone network under different batchsizes
    ParameterAccuracySensitivitySpecificityF1-score
    Correlation score0.0835-0.07840.10560.0753
    p-value0.87500.88260.84230.8873
    Table 4. The Pearson correlation scores and their p-values between the four metrics and the batchsize in Table 3
    Hongxiao Li, Shu Li, Xiafei Shi, Xiaoxi Dong, Ge Jin, Lanping Zhu, Yingxin Li, Huijuan Yin. BiT-Based Early Gastric Cancer Classification Using Endoscopic Images[J]. Laser & Optoelectronics Progress, 2022, 59(6): 0617028
    Download Citation