• Chinese Optics Letters
  • Vol. 19, Issue 7, 070601 (2021)
Zhe Zhang1、2, Yingying Wang1, Min Zhou2, Jun He2、*, Changrui Liao2, and Yiping Wang2
Author Affiliations
  • 1Guangdong Provincial Key Laboratory of Optical Fiber Sensing and Communication, Institute of Photonics Technology, Jinan University, Guangzhou 511443, China
  • 2Key Laboratory of Optoelectronic Devices and Systems of Ministry of Education/Guangdong Province, College of Physics and Optoelectronic Engineering, Shenzhen University, Shenzhen 518060, China
  • show less
    DOI: 10.3788/COL202119.070601 Cite this Article Set citation alerts
    Zhe Zhang, Yingying Wang, Min Zhou, Jun He, Changrui Liao, Yiping Wang. Recent advance in hollow-core fiber high-temperature and high-pressure sensing technology [Invited][J]. Chinese Optics Letters, 2021, 19(7): 070601 Copy Citation Text show less
    (a) Schematic diagram of the proposed SMF-HCF-SMF temperature sensor; (b) simulation result of light propagation in the SMF-HCF-SMF configuration at 1550 nm.
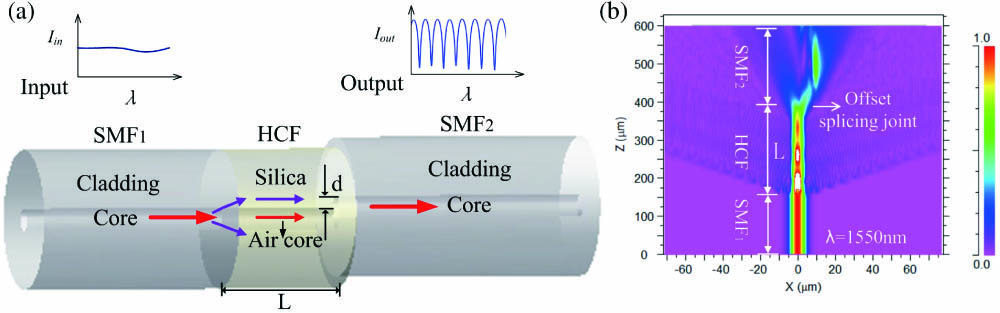
    Fig. 1. (a) Schematic diagram of the proposed SMF-HCF-SMF temperature sensor; (b) simulation result of light propagation in the SMF-HCF-SMF configuration at 1550 nm.
    (a) Transmission spectra for different offset distances; inset: transmission spectrum shrinking; (b) fringe contrast versus offset distance.
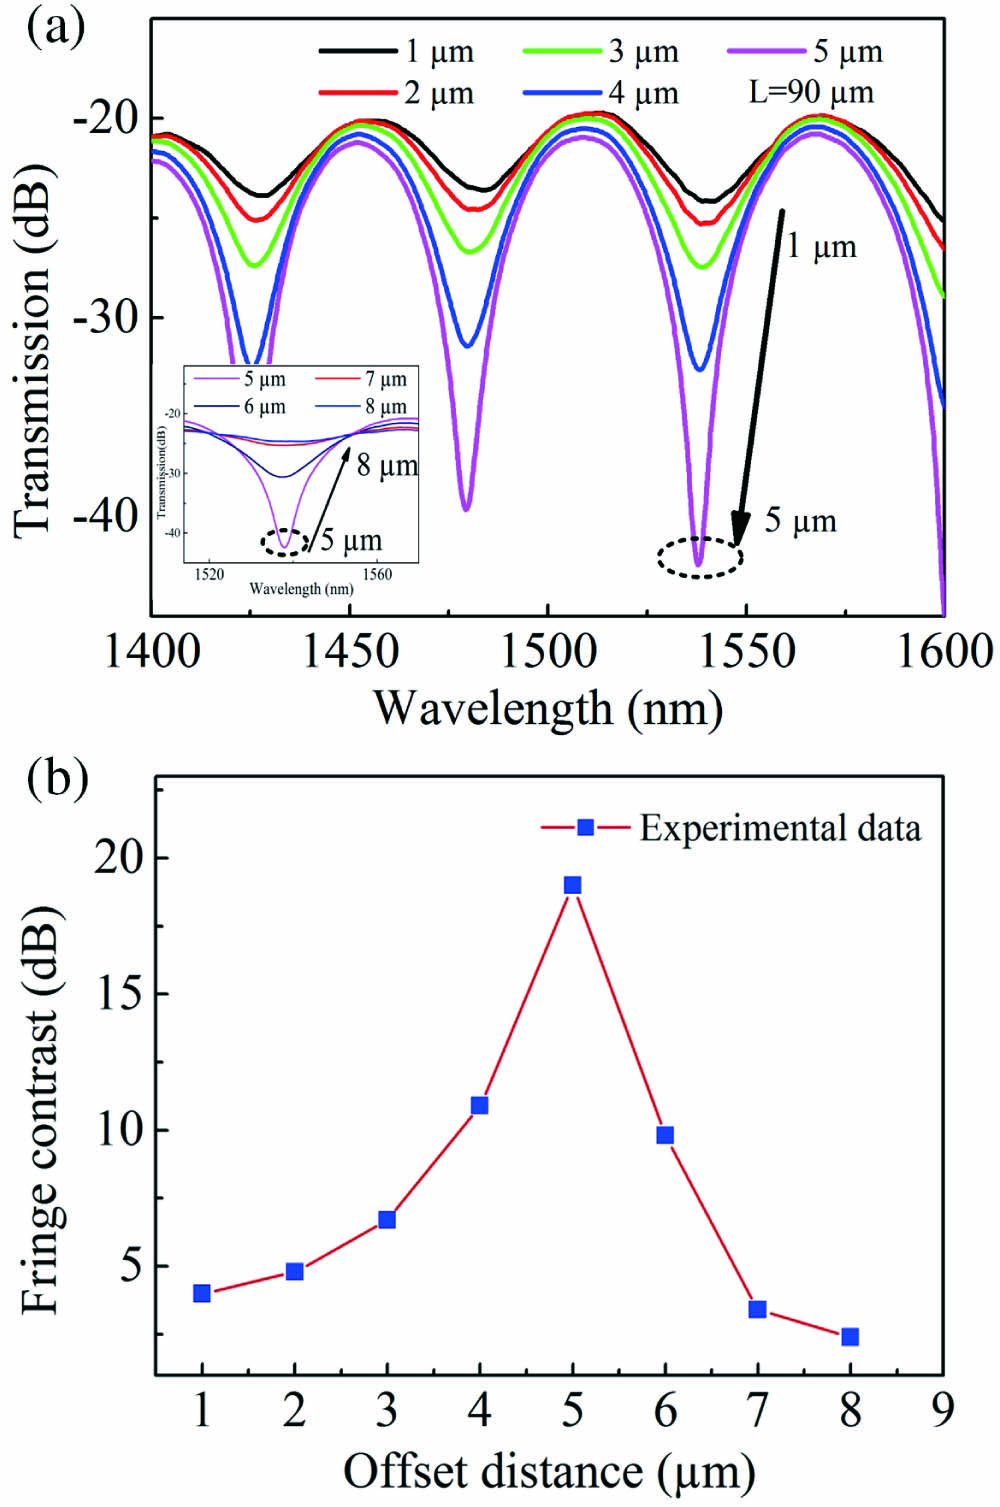
    Fig. 2. (a) Transmission spectra for different offset distances; inset: transmission spectrum shrinking; (b) fringe contrast versus offset distance.
    (a) Side view of the sensing head; (b) cross section of the HCF; (c) near field image at the end facet of a 90 µm HCF with the other end facet aligned to the lead-in SMF1.
    Fig. 3. (a) Side view of the sensing head; (b) cross section of the HCF; (c) near field image at the end facet of a 90 µm HCF with the other end facet aligned to the lead-in SMF1.
    (a) Transmission spectrum evolution from 200°C to 900°C; (b) wavelength of the interference minimum around 1401, 1471, and 1550 nm versus heating time at 900°C, respectively; (c) transmission spectrum evolution from 900°C to 200°C.
    Fig. 4. (a) Transmission spectrum evolution from 200°C to 900°C; (b) wavelength of the interference minimum around 1401, 1471, and 1550 nm versus heating time at 900°C, respectively; (c) transmission spectrum evolution from 900°C to 200°C.
    Dip wavelength versus temperature in both heating and cooling processes (a) before and (b) after three cycles of annealing.
    Fig. 5. Dip wavelength versus temperature in both heating and cooling processes (a) before and (b) after three cycles of annealing.
    Schematic illustration of the proposed FPI sensor. FPI, Fabry–Perot interferometer; SMF, single-mode fiber; I1/I2, intensity ratio; I0, the intensity of the incident light; HCF, hollow-core fiber; L, length of HCF; interface I, the SMF end facet; interface II, the HCF end facet.
    Fig. 6. Schematic illustration of the proposed FPI sensor. FPI, Fabry–Perot interferometer; SMF, single-mode fiber; I1/I2, intensity ratio; I0, the intensity of the incident light; HCF, hollow-core fiber; L, length of HCF; interface I, the SMF end facet; interface II, the HCF end facet.
    Reflection spectra of the prepared FPIs with different HCF parameters.
    Fig. 7. Reflection spectra of the prepared FPIs with different HCF parameters.
    Frequency spectra of the interference spectra of (a) S3 and (b) S4 obtained by fast Fourier transform (FFT).
    Fig. 8. Frequency spectra of the interference spectra of (a) S3 and (b) S4 obtained by fast Fourier transform (FFT).
    Wavelength of the tracked dip as a function of temperature for different temperature ranges: (a) 100°C–300°C, (b) 100°C–400°C, (c) 100°C–500°C, (d) 100°C–600°C, (e) 100°C–700°C, (f) 100°C–800°C, (g) first 100°C–900°C, (h) second 100°C–900°C, (i) 100°C–1000°C, and (j) 100°C–1100°C.
    Fig. 9. Wavelength of the tracked dip as a function of temperature for different temperature ranges: (a) 100°C–300°C, (b) 100°C–400°C, (c) 100°C–500°C, (d) 100°C–600°C, (e) 100°C–700°C, (f) 100°C–800°C, (g) first 100°C–900°C, (h) second 100°C–900°C, (i) 100°C–1000°C, and (j) 100°C–1100°C.
    Schematic diagram of the open-cavity FPI gas pressure sensor based on HC-PBF.
    Fig. 10. Schematic diagram of the open-cavity FPI gas pressure sensor based on HC-PBF.
    (a) SEM images of the employed HC-PBF and HCF and (b) locally enlarged view.
    Fig. 11. (a) SEM images of the employed HC-PBF and HCF and (b) locally enlarged view.
    (a) Microscope images of the prepared sensor samples (S1–S6) with varying cavity lengths; (b) the corresponding reflection spectra.
    Fig. 12. (a) Microscope images of the prepared sensor samples (S1–S6) with varying cavity lengths; (b) the corresponding reflection spectra.
    Schematic illustration of the gas pressure generator.
    Fig. 13. Schematic illustration of the gas pressure generator.
    Wavelength of the tracked dip versus pressure in both the boosting and depressurizing processes.
    Fig. 14. Wavelength of the tracked dip versus pressure in both the boosting and depressurizing processes.
    Gas pressure sensitivities of the sensor at different wavelengths.
    Fig. 15. Gas pressure sensitivities of the sensor at different wavelengths.
    (a) Wavelength and (b) visibility of the three tracked dips versus annealing time at 800°C.
    Fig. 16. (a) Wavelength and (b) visibility of the three tracked dips versus annealing time at 800°C.
    Reflection spectra of the prepared sensor samples with different cavity lengths (S1: 107 µm, S2: 1.1 mm, S3: 2.1 mm, and S4: 12.3 mm).
    Fig. 17. Reflection spectra of the prepared sensor samples with different cavity lengths (S1: 107 µm, S2: 1.1 mm, S3: 2.1 mm, and S4: 12.3 mm).
    Measured (a) transmission and (b) reflection spectra of the FPI with a 12.3 mm cavity; (c) enlarged view of the FPI reflection spectrum at ∼1550 nm.
    Fig. 18. Measured (a) transmission and (b) reflection spectra of the FPI with a 12.3 mm cavity; (c) enlarged view of the FPI reflection spectrum at ∼1550 nm.
    (a) Calculated OPDs of FPIs with different cavity lengths L as a function of the gas RI; (b) calculated gas RI sensitivity versus FPI cavity length L.
    Fig. 19. (a) Calculated OPDs of FPIs with different cavity lengths L as a function of the gas RI; (b) calculated gas RI sensitivity versus FPI cavity length L.
    Demodulated OPDs of the four sensor samples as a function of the gas pressure in a range of 0.1–4.0 MPa: (a) S1 (L = 107 µm), (b) S2 (L = 1.1 mm), (c) S3 (L = 2.1 mm), and (d) S4 (L = 12.3 mm).
    Fig. 20. Demodulated OPDs of the four sensor samples as a function of the gas pressure in a range of 0.1–4.0 MPa: (a) S1 (L = 107 µm), (b) S2 (L = 1.1 mm), (c) S3 (L = 2.1 mm), and (d) S4 (L = 12.3 mm).
    Demodulated OPDs of four sensor samples as a function of the gas pressure in a range of 1–10 MPa: (a) S5 (L = 2.7 mm), (b) S6 (L = 6.7 mm), (c) S7 (L = 12.4 mm), and (d) S8 (L = 24.9 mm).
    Fig. 21. Demodulated OPDs of four sensor samples as a function of the gas pressure in a range of 1–10 MPa: (a) S5 (L = 2.7 mm), (b) S6 (L = 6.7 mm), (c) S7 (L = 12.4 mm), and (d) S8 (L = 24.9 mm).
    Gas pressure sensitivities of the eight sensor samples (S1–S8) as a function of the cavity length L.
    Fig. 22. Gas pressure sensitivities of the eight sensor samples (S1–S8) as a function of the cavity length L.
    (a) Schematic diagram of the proposed dual-cavity FPI sensor; (b) sideview microscopy of the sensor.
    Fig. 23. (a) Schematic diagram of the proposed dual-cavity FPI sensor; (b) sideview microscopy of the sensor.
    Reflection spectra and the corresponding microscopy images of the four fabricated dual-cavity FPI sensors (S1–S4) with different combinations of cavity lengths.
    Fig. 24. Reflection spectra and the corresponding microscopy images of the four fabricated dual-cavity FPI sensors (S1–S4) with different combinations of cavity lengths.
    (a) Reflection spectrum of S1 and (b) the FFT spectrum of (a); also shown are the separated reflection spectra of (c) cavity 1 and (d) cavity 2, respectively, by bandpass filtering.
    Fig. 25. (a) Reflection spectrum of S1 and (b) the FFT spectrum of (a); also shown are the separated reflection spectra of (c) cavity 1 and (d) cavity 2, respectively, by bandpass filtering.
    OPD of the two cavities as a function of gas pressure.
    Fig. 26. OPD of the two cavities as a function of gas pressure.
    OPD of the two cavities as a function of temperature.
    Fig. 27. OPD of the two cavities as a function of temperature.
    Microscopy image of the sensor S1 after conducting high-pressure and high-temperature tests.
    Fig. 28. Microscopy image of the sensor S1 after conducting high-pressure and high-temperature tests.
    λ (μm)n (26°C)n (471°C)dn/dT (10−6 °C−1)n (828°C)dn/dT (10−6 °C−1)
    0.578001.458991.46429+11.91.46870+12.1
    1.128661.449031.45426+11.81.45820+11.4
    1.367281.446351.45140+11.41.45549+11.4
    1.529251.444441.44961+11.61.45352+11.3
    1.660001.443071.44799+11.11.45174+10.8
    Table 1. Refractive Index of Fused Silica versus Temperature[74]
    Cavity Length (μm)FSR (at 1550nm) (nm)Sensitivity (at 1550nm) (nm/MPa)R2
    6520.74.170.9998
    10512.44.360.9999
    1258.94.200.9998
    1846.34.170.9999
    1905.34.130.9999
    4602.54.190.9997
    Table 2. Performance Comparisons of Sensor Samples with Varying FPI Cavity Lengths
    Zhe Zhang, Yingying Wang, Min Zhou, Jun He, Changrui Liao, Yiping Wang. Recent advance in hollow-core fiber high-temperature and high-pressure sensing technology [Invited][J]. Chinese Optics Letters, 2021, 19(7): 070601
    Download Citation