
Zhe Zhang, Yingying Wang, Min Zhou, Jun He, Changrui Liao, Yiping Wang, "Recent advance in hollow-core fiber high-temperature and high-pressure sensing technology [Invited]," Chin. Opt. Lett. 19, 070601 (2021)
- Chinese Optics Letters
- Vol. 19, Issue 7, 070601 (2021)
Abstract
1. Introduction
Measurement of high temperature and high pressure is of great significance in modern industries such as aerospace, chemical industry, deep-water exploration, and petroleum drilling. Since the 1970s, optical fiber sensing technology has become tremendously successful owing to its high integration, immunity to electromagnetic interference, resistance to harsh environments, as well as capability of networking and distributed sensing[
Hollow-core fibers (HCFs) guide light in the air core and can be classified into two categories: photonic bandgap (PBG) and anti-resonant reflection (ARR) HCFs according to the light confinement mechanism. Among the ARR-HCFs, hollow silica capillaries can be considered as the most original HCF, which exhibits large loss and thus is limited to the ultrashort-distance transmission. Typically, HCFs are drawn from pure-silica capillaries[
This paper reviews our works over the past five years, which focused on the design, preparation, and characterization of the HCF microcavity high-temperature and high-pressure sensors. Section 2 describes the high-temperature sensors based on HCF MZIs and fiber-tip FPIs, respectively. Section 3 includes the HCF high-pressure sensors with wavelength and phase demodulation approaches, respectively. In Section 4, a dual-cavity FPI sensor for simultaneous measurement of high temperature and high pressure is detailed. A brief conclusion and prospects of the HCF-based high-temperature and high-pressure sensing technology are discussed in Section 5.
Sign up for Chinese Optics Letters TOC. Get the latest issue of Chinese Optics Letters delivered right to you!Sign up now
2. HCF High-Temperature Sensors
Optical fiber microcavity MZIs or FPIs have been widely adopted for temperature sensing, which shows advantages of compactness, high sensitivity, and low costs. Tapering, arc discharge, and ultrafast laser micromachining are typical approaches for creating microcavities in conventional solid-core fibers. However, the microcavity quality and preparation repeatability are crucially limited by the processing technique. Moreover, repeated adiabatic annealing is necessary for the sensor to release the residual stress and improve the linearity of the sensor. Instead, HCFs provide a natural high-quality microcavity, which does not only improve the preparation repeatability but renders a higher working temperature and linearity.
2.1. MZI high-temperature sensor
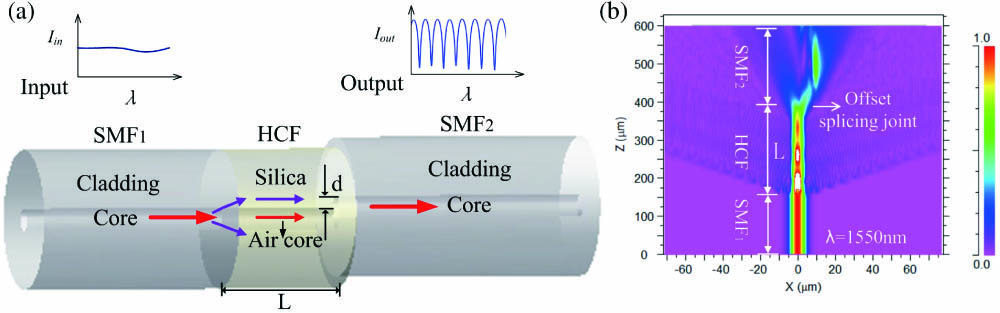
The MZI high-temperature sensor can be simply constructed by sandwiching a short piece of HCF between two single-mode fibers (SMFs) with precious slicing and optimized arc discharge techniques[
![]()
Figure 1.(a) Schematic diagram of the proposed SMF-HCF-SMF temperature sensor; (b) simulation result of light propagation in the SMF-HCF-SMF configuration at 1550 nm.
The thermo-optic and thermo-expansion coefficients differences between silica and air will result in the change of
| 0.57800 | 1.45899 | 1.46429 | 1.46870 | ||
| 1.12866 | 1.44903 | 1.45426 | 1.45820 | ||
| 1.36728 | 1.44635 | 1.45140 | 1.45549 | ||
| 1.52925 | 1.44444 | 1.44961 | 1.45352 | ||
| 1.66000 | 1.44307 | 1.44799 | 1.45174 |
Table 1. Refractive Index of Fused Silica versus Temperature[74]
The thermal-expansion coefficient of fused silica[
![]()
Figure 2.(a) Transmission spectra for different offset distances; inset: transmission spectrum shrinking; (b) fringe contrast versus offset distance.
![]()
Figure 3.(a) Side view of the sensing head; (b) cross section of the HCF; (c) near field image at the end facet of a 90 µm HCF with the other end facet aligned to the lead-in SMF1.
High-temperature tests are subsequently carried out by employing a high-temperature oven that can reach 1200°C with an accuracy of
![]()
Figure 4.(a) Transmission spectrum evolution from 200°C to 900°C; (b) wavelength of the interference minimum around 1401, 1471, and 1550 nm versus heating time at 900°C, respectively; (c) transmission spectrum evolution from 900°C to 200°C.
![]()
Figure 5.Dip wavelength versus temperature in both heating and cooling processes (a) before and (b) after three cycles of annealing.
2.2. Annealing-free fiber-tip FPI high-temperature sensor
To eliminate the adverse impact of residual stress as well as high-order modes distraction, we propose an annealing-free HCF-tip FPI high-temperature (1100°C) sensor[
![]()
Figure 6.Schematic illustration of the proposed FPI sensor. FPI, Fabry–Perot interferometer; SMF, single-mode fiber; I1/I2, intensity ratio; I0, the intensity of the incident light; HCF, hollow-core fiber; L, length of HCF; interface I, the SMF end facet; interface II, the HCF end facet.
![]()
Figure 7.Reflection spectra of the prepared FPIs with different HCF parameters.
In addition, the length
![]()
Figure 8.Frequency spectra of the interference spectra of (a) S3 and (b) S4 obtained by fast Fourier transform (FFT).
High-temperature performance of the proposed fiber-tip FPI sensor is then experimentally studied, and the experimental equipment is the same as described above. Although the temperature sensitivity is wavelength dependent, while for simplicity and clarity purposes, we employ the interference dip at
![]()
Figure 9.Wavelength of the tracked dip as a function of temperature for different temperature ranges: (a) 100°C–300°C, (b) 100°C–400°C, (c) 100°C–500°C, (d) 100°C–600°C, (e) 100°C–700°C, (f) 100°C–800°C, (g) first 100°C–900°C, (h) second 100°C–900°C, (i) 100°C–1000°C, and (j) 100°C–1100°C.
As such, the fiber-tip FPI sensor can work in a harsh environment of 1100°C with a high measurement linearity, which can be attributed to the excellent temperature performance of pure-silica HCFs. Meanwhile, the excellent high-temperature performance of the sensor before high-temperature annealing also confirms our conjecture that the HCF high-temperature sensor could dismiss the complicated isothermal annealing processes effectively. Linear fittings yield a temperature sensitivity of 12.5, 13.0, 13.7, 14.0, 14.4, 14.8, 15.1, 14.8, 15.1, and 15.2 pm/°C in each temperature range, respectively. Considering the wavelength resolution (0.02 nm) of the employed OSA and a temperature sensitivity of 15 pm/°C, a minimal temperature resolution of the sensor is
3. HCF High-Pressure Sensors
In this section, we present two gas pressure sensors based on hollow-core PBG fiber (HC-PBF), which exhibit ultrahigh linearity and sensitivity. Wavelength and phase demodulation methods are compared and applied to these two sensors, respectively.
3.1. Wavelength-demodulated open-cavity FPI high-pressure sensor
The most common fiber-optic gas pressure sensor is fiber-tip elastic diaphragm FPI, which is an enclosed cavity that is based on a gas pressure-induced deformation of the diaphragm (i.e., cavity length change)[
![]()
Figure 10.Schematic diagram of the open-cavity FPI gas pressure sensor based on HC-PBF.
![]()
Figure 11.(a) SEM images of the employed HC-PBF and HCF and (b) locally enlarged view.
Figures 12(a) and 12(b) present the prepared sensors with varying FPI cavity lengths and the corresponding reflection spectra, respectively. A longer cavity with narrower full width at half-wave (FWHW) is available, but not shown for the purpose of brevity. The cavity length and corresponding free spectrum range (FSR) of the six sensor samples are shown in the first two columns of Table 2. The FSR can be denoted as
| Sensitivity (at | |||
|---|---|---|---|
| 65 | 20.7 | 4.17 | 0.9998 |
| 105 | 12.4 | 4.36 | 0.9999 |
| 125 | 8.9 | 4.20 | 0.9998 |
| 184 | 6.3 | 4.17 | 0.9999 |
| 190 | 5.3 | 4.13 | 0.9999 |
| 460 | 2.5 | 4.19 | 0.9997 |
Table 2. Performance Comparisons of Sensor Samples with Varying FPI Cavity Lengths
![]()
Figure 12.(a) Microscope images of the prepared sensor samples (S1–S6) with varying cavity lengths; (b) the corresponding reflection spectra.
The sensor samples are encapsulated in the gas cell successively, and the pressure is gradually increased from 0 to 8 MPa in a step of 0.2 MPa. The gas pressure generator is schematically illustrated in Fig. 13. One of the interference dips near 1550 nm is traced as a pressure indicator, and a linear “redshift” is observed as pressure rising. Figure 14 shows the wavelength of the tracked dip versus pressure in both the boosting and depressurizing processes for a sensor with a
![]()
Figure 13.Schematic illustration of the gas pressure generator.
![]()
Figure 14.Wavelength of the tracked dip versus pressure in both the boosting and depressurizing processes.
![]()
Figure 15.Gas pressure sensitivities of the sensor at different wavelengths.
As pressure increases, the RI of air in the cavity increases according to
It is worth noting that the cavity length has nothing to do with the wavelength sensitivity. Meanwhile, a longer cavity renders a much smaller FWHW, which determines the demodulation resolution of the wavelength. Considering a wavelength demodulator with 0.1 pm resolution, an extremely low detection limit of
High-temperature resistance of the high-pressure sensor is studied by high-temperature experiments. The wavelengths of tracked dips are recorded by an optical spectrum analyzer (OSA) over a period of 4 h at a temperature of 800°C. Figure 16 depicts the wavelength of tracked dips versus annealing time at 800°C environments, where excellent thermal resistance is confirmed. Then, the temperature is increased from room temperature (
![]()
Figure 16.(a) Wavelength and (b) visibility of the three tracked dips versus annealing time at 800°C.
3.2. Phase-demodulated long-cavity FPI high-pressure sensor
As discussed in Section 3.1, the cavity length of the FPI has nothing to do with the wavelength sensitivity, while the optical phase changing is in proportion to the cavity length. Based on this principle, we propose an ultralong air-cavity fiber FPI sensor based on HC-PBF and phase demodulation method in this section. The sensor structure is similar to Fig. 10, where the only difference is a longer cavity (i.e., longer HC-PBF) and the phase demodulation approach. The low-loss HC-PBFs enable a long air cavity without large compromise for the fringe visibility. Four sensor samples (
![]()
Figure 17.Reflection spectra of the prepared sensor samples with different cavity lengths (S1: 107 µm, S2: 1.1 mm, S3: 2.1 mm, and S4: 12.3 mm).
![]()
Figure 18.Measured (a) transmission and (b) reflection spectra of the FPI with a 12.3 mm cavity; (c) enlarged view of the FPI reflection spectrum at ∼1550 nm.
Theory calculation of the phase sensitivity of the sensor is performed, and phase difference of the two beams can be represented by the OPD between the two beams, which can be expressed by
Here,
The OPD versus gas RI for different cavity lengths
![]()
Figure 19.(a) Calculated OPDs of FPIs with different cavity lengths L as a function of the gas RI; (b) calculated gas RI sensitivity versus FPI cavity length L.
The same setup as above is employed for gas pressure tests. Four prepared sensor samples S1–S4 are subsequently sealed into an air chamber, respectively, where the temperature is kept at 25°C for the whole time. The gas pressure is increased from standard atmospheric pressure to 4 MPa in a step of 0.5 MPa. At each measured point, the reflection spectra are recorded by the OSA. The Fourier phase interrogation method reported in Refs. [37,89,90] is applied to the recorded reflection spectra, and the OPD change with respect to the gas pressure is illustrated in Figs. 20(a)–20(d), where the gas pressure sensitivities (by linear fitting) are 0.55, 6.01, 10.14, and 61.70 µm/MPa, respectively. With the elongating of the cavity, the sensitivity exhibits a linear increase, where the linearity is higher than 0.99, confirming the accuracy of the employed phase interrogation method.
![]()
Figure 20.Demodulated OPDs of the four sensor samples as a function of the gas pressure in a range of 0.1–4.0 MPa: (a) S1 (L = 107 µm), (b) S2 (L = 1.1 mm), (c) S3 (L = 2.1 mm), and (d) S4 (L = 12.3 mm).
The sensor performance at a higher gas pressure of 0.1–10 MPa is further studied. Another four sensor samples (
![]()
Figure 21.Demodulated OPDs of four sensor samples as a function of the gas pressure in a range of 1–10 MPa: (a) S5 (L = 2.7 mm), (b) S6 (L = 6.7 mm), (c) S7 (L = 12.4 mm), and (d) S8 (L = 24.9 mm).
![]()
Figure 22.Gas pressure sensitivities of the eight sensor samples (S1–S8) as a function of the cavity length L.
4. Simultaneous Measurement of High Temperature and High Pressure Using an HCF Dual-Cavity FPI
As demonstrated in the last two sections, silica and air cavities present excellent high-temperature and high-pressure responses, respectively. As such, a silica/air hybrid cavity may address the issue of simultaneous measurement of high temperature and high pressure. Figure 23(a) shows a schematic of a silica/air dual-cavity FPI sensor configuration, where the HC-PBF acts as the air cavity (cavity 1), while the HCF acts as both the silica cavity (cavity 2) and vessel for the gas inlet simultaneously. The sensor structure has no significant change in comparison with the sensor described in the last chapter, except for the addition of reflection interface III. As such, the vital task locates in the separation and interrogation of the superimposed interference spectrum.
![]()
Figure 23.(a) Schematic diagram of the proposed dual-cavity FPI sensor; (b) sideview microscopy of the sensor.
Four sensor samples (S1–S4) with different cavity length combinations are prepared, and the morphologies as well as the corresponding reflection spectra are illustrated in Fig. 24. The cavity length combinations of S1–S4 are 226/634, 261/751, 242/957, and 621/1491 µm, respectively, and the reflection spectra are all characterized by fine fringes modulated by large envelopes, indicating multibeam interference. As demonstrated in the last chapter, the OPDs of the silica and air cavity are sensitive to the temperature and gas pressure, respectively. The crosstalk of temperature and pressure can be estimated to be 268 Pa/°C at the atmospheric pressure and 100°C by Eq. (11). As a result, cavity 1 can be utilized as a gas pressure sensor. In contrast, the OPD of cavity 2 changes significantly with temperature, while it hardly changes with the gas pressure. As such, cavity 2 can be employed as a temperature indicator. For interrogating the OPDs of the two cavities respectively, an FFT and frequency filtering method is applied to the superimposed interference spectrum.
![]()
Figure 24.Reflection spectra and the corresponding microscopy images of the four fabricated dual-cavity FPI sensors (S1–S4) with different combinations of cavity lengths.
The reflection spectrum of
![]()
Figure 25.(a) Reflection spectrum of S1 and (b) the FFT spectrum of (a); also shown are the separated reflection spectra of (c) cavity 1 and (d) cavity 2, respectively, by bandpass filtering.
Sensor sample
![]()
Figure 26.OPD of the two cavities as a function of gas pressure.
![]()
Figure 27.OPD of the two cavities as a function of temperature.
According to the experimental results, the temperature drift is calculated to be
![]()
Figure 28.Microscopy image of the sensor S1 after conducting high-pressure and high-temperature tests.
5. Conclusion
In summary, this paper reviewed our recent works on high-temperature and high-pressure sensing technologies based on HCFs. A variety of sensor structures, different sensing mechanisms, and demodulation methods are detailed. Further improvements may be located in the fast and dynamic demodulation techniques of temperature and pressure, which can eliminate the environment-induced phase shift effectively and meet the critical demand for dynamic measurement of high temperature and high pressure. In addition, the package techniques of the fiber-optic high-temperature and high-pressure sensors are equally important for practical applications. It is worth noting that the high-temperature and high-pressure sensing techniques reviewed in this paper are merely a small part of the many applications of HCFs. The technical advancements of HCFs achieved in recent years have accelerated the growth of HCFs and their applications significantly. More and more vital applications of HCFs in extreme environment sensing can be expected in the coming decade.
References
[1] G. B. Hocker. Fiber-optic sensing of pressure and temperature. Appl. Opt., 18, 1445(1979).
[2] A. K. Sharma, R. Jha, B. D. Gupta. Fiber-optic sensors based on surface plasmon resonance: a comprehensive review. IEEE Sens. J., 7, 1118(2007).
[3] A. Leung, P. M. Shankar, R. Mutharasan. A review of fiber-optic biosensors. Sens. Actuat. B: Chem., 125, 688(2007).
[4] M. Majumder, T. K. Gangopadhyay, A. K. Chakraborty, K. Dasgupta, D. K. Bhattacharya. Fiber Bragg gratings in structural health monitoring—present status and applications. Sens. Actuat. A: Phys., 147, 150(2008).
[5] S. J. Mihailov. Fiber Bragg grating sensors for harsh environments. Sensors, 12, 1898(2012).
[6] J. Albert, L. Y. Shao, C. Caucheteur. Tilted fiber Bragg grating sensors. Laser Photon. Rev., 7, 83(2013).
[7] X. J. Fan, J. F. Jiang, X. Z. Zhang, K. Liu, T. G. Liu. Investigation on temperature characteristics of weak fiber Bragg gratings in a wide range. Chin. Opt. Lett., 17, 120603(2019).
[8] Y. M. Zhang, D. D. Rong, L. Q. Zhu, M. L. Dong, F. Luo. Regenerated fiber Bragg grating for fiber laser sensing at high temperatures. Chin. Opt. Lett., 16, 040606(2018).
[9] C. W. Smelser, S. J. Mihailov, D. Grobnic. Formation of type I-IR and Type II-IR gratings with an ultrafast IR laser and a phase mask. Opt. Express, 13, 5377(2005).
[10] Y. Wang, Y. H. Li, C. R. Liao, D. N. Wang, M. W. Yang, P. X. Lu. High-temperature sensing using miniaturized fiber in-line Mach–Zehnder interferometer. IEEE Photon. Technol. Lett., 22, 39(2009).
[11] S. C. Warren-Smith, L. V. Nguyen, C. Lang, H. E. Heidepriem, T. M. Monro. Temperature sensing up to 1300°C using suspended-core microstructured optical fibers. Opt. Express, 24, 3714(2016).
[12] C. Wang, J. C. Zhang, C. Z. Zhang, J. He, Y. C. Lin, W. Jin, C. R. Liao, Y. Wang, Y. P. Wang. Bragg gratings in suspended-core photonic microcells for high-temperature applications. J. Lightwave Technol., 36, 2920(2018).
[13] J. He, Y. P. Wang, C. R. Liao, C. Wang, S. Liu, K. M. Yang, Y. Wang, X. C. Yuan, G. P. Wang, W. J. Zhang. Negative-index gratings formed by femtosecond laser overexposure and thermal regeneration. Sci. Rep., 6, 23379(2016).
[14] S. Liu, L. Jin, W. Jin, D. N. Wang, C. R. Liao, Y. Wang. Structural long period gratings made by drilling micro-holes in photonic crystal fibers with a femtosecond infrared laser. Opt. Express, 18, 5496(2010).
[15] D. Grobnic, S. J. Mihailov, C. W. Smelser, H. Ding. Sapphire fiber Bragg grating sensor made using femtosecond laser radiation for ultrahigh temperature applications. IEEE Photon. Technol. Lett., 16, 2505(2004).
[16] M. Busch, W. Ecke, I. Latka, D. Fischer, R. Willsch, H. Bartelt. Inscription and characterization of Bragg gratings in single-crystal sapphire optical fibers for high-temperature sensor applications. Meas. Sci. Technol., 20, 115301(2009).
[17] T. Elsmann, T. Habisreuther, A. Graf, M. Rothhardt, H. Bartelt. Inscription of first-order sapphire Bragg gratings using 400 nm femtosecond laser radiation. Opt. Express, 21, 4591(2013).
[18] T. Habisreuther, T. Elsmann, Z. Pan, Z. Graf, R. Willsch, M. A. Schmidt. Sapphire fiber Bragg gratings for high temperature and dynamic temperature diagnostics. Appl. Therm. Eng., 91, 860(2015).
[19] S. Yang, D. Hu, A. B. Wang. Point-by-point fabrication and characterization of sapphire fiber Bragg gratings. Opt. Lett., 42, 4219(2017).
[20] C. Chen, X. Y. Zhang, Y. S. Yu, W. H. Wei, Q. Guo, L. Qin, Y. Q. Ning, L. J. Wang, H. B. Sun. Femtosecond laser-inscribed high-order Bragg gratings in large-diameter sapphire fibers for high-temperature and strain sensing. J. Lightwave Technol., 36, 3302(2018).
[21] X. Z. Xu, J. He, C. R. Liao, K. M. Yang, K. K. Guo, C. Li, Y. F. Zhang, Z. B. Ouyang, Y. P. Wang. Sapphire fiber Bragg gratings inscribed with a femtosecond laser line-by-line scanning technique. Opt. Lett., 43, 4562(2018).
[22] X. W. Shu, Z. Lin, I. Bennion. Sensitivity characteristics of long-period fiber gratings. J. Lightwave Technol., 20, 255(2002).
[23] Y. J. Rao, Z. L. Ran, X. Liao, H. Y. Deng. Hybrid LPFG/MEFPI sensor for simultaneous measurement of high-temperature and strain. Opt. Express, 15, 14936(2007).
[24] Y. J. Rao, Y. P. Wang, Z. L. Ran, T. Zhu. Novel fiber-optic sensors based on long-period fiber gratings written by high-frequency CO2 laser pulses. J. Lightwave Technol., 21, 1320(2003).
[25] G. Rego, O. Okhotnikov, E. Dianov, V. Sulimov. High-temperature stability of long-period fiber gratings produced using an electric arc. J. Lightwave Technol., 19, 1574(2001).
[26] G. Rego. Arc-induced long-period fiber gratings. J. Sens., 2016, 3598634(2016).
[27] G. Humbert, A. Malki. Characterizations at very high temperature of electric arc-induced long-period fiber gratings. Opt. Commun., 208, 329(2002).
[28] L. Jiang, J. Yang, S. Wang, B. Li, M. Wang. Fiber Mach–Zehnder interferometer based on microcavities for high-temperature sensing with high sensitivity. Opt. Lett., 36, 3753(2011).
[29] N. Zhao, Q. J. Lin, W. X. Jing, Z. D. Jiang, Z. R. Wu, K. Yao, B. Tian, Z. K. Zhang, P. Shi. High temperature high sensitivity Mach–Zehnder interferometer based on waist-enlarged fiber bitapers. Sens. Actuat. A: Phys., 267, 491(2017).
[30] A. A. Jasim, S. W. Harun, H. Arof, H. Ahmad. Inline microfiber Mach–Zehnder interferometer for high temperature sensing. IEEE Sens. J., 13, 626(2013).
[31] Z. Zhang, C. R. Liao, J. Tang, Y. Wang, Z. Y. Bai, Z. Y. Li, K. K. Guo, M. Deng, S. Q. Cao, Y. P. Wang. Hollow-core-fiber-based interferometer for high temperature measurement. IEEE Photon. J., 9, 7101109(2017).
[32] J. Zhang, H. Sun, Q. Z. Rong, X. G. Qiao. High-temperature sensor using a Fabry–Perot interferometer based on solid-core photonic crystal fiber. Chin. Opt. Lett., 10, 070607(2012).
[33] P. Chen, X. W. Shu. Refractive-index-modified-dot Fabry–Perot fiber probe fabricated by femtosecond laser for high-temperature sensing. Opt. Express, 26, 5292(2018).
[34] D. W. Duan, Y. J. Rao, W. Wen, J. Yao, D. Wu, L. Xu, T. Zhu. In-line all-fiber Fabry–Perot interferometer high temperature sensor formed by large lateral offset splicing. Electronics, 47, 401(2011).
[35] Z. S. Chen, S. S. Xiong, S. C. Gao, H. Zhang, L. Wan, X. C. Huang, B. S. Huang, Y. H. Feng, W. P. Liu, Z. H. Li. High-temperature sensor based on Fabry–Perot interferometer in microfiber tip. Sensors, 18, C1(2018).
[36] X. L. Tan, Y. F. Geng, X. J. Li, G. Rong, Z. Yin. High temperature microstructured fiber sensor based on a partial-reflection-enabled intrinsic Fabry–Perot interferometer. Appl. Opt., 52, 8195(2013).
[37] Z. Zhang, J. He, B. Du, F. C. Zhang, K. K. Guo, Y. P. Wang. Measurement of high pressure and high temperature using a dual-cavity Fabry–Perot interferometer created in cascade hollow-core fibers. Opt. Lett., 43, 6009(2018).
[38] Z. Zhang, B. J. Xu, M. Zhou, W. J. Bao, X. Z. Xu, Y. P. Wang. Hollow-core fiber-tip interferometric high-temperature sensor operating at 1100°C. Micromachines, 12, 234(2021).
[39] Y. H. Li, C. R. Liao, D. N. Wang, T. Sun, K. Grattan. Study of spectral and annealing properties of fiber Bragg gratings written in H2-free and H2-loaded fibers by use of femtosecond laser pulses. Opt. Express, 16, 21239(2008).
[40] D. Grobnic, C. Smelser, S. Mihailov, R. Walker. Long-term thermal stability tests at 1000°C of silica fiber Bragg gratings made with ultrafast laser radiation. Meas. Sci. Technol., 17, 1009(2006).
[41] U. Paek, C. Kurkjian. Calculation of cooling rate and induced stresses in drawing of optical fibers. J. Am. Ceram. Soc., 58, 330(1975).
[42] D. Wissuchek, C. Ponader, J. Price. Analysis of residual stress in optical fiber. Proc. SPIE, 3848, 34(1999).
[43] Y. H. Li, M. W. Yang, D. N. Wang, J. Lu, T. Sun, K. Grattan. Fiber Bragg gratings with enhanced thermal stability by residual stress relaxation. Opt. Express, 17, 19785(2008).
[44] R. F. Cregan, B. Mangan, J. C. Knight, T. A. Birks, P. St.J. Russell, P. J. Roberts, D. C. Allan. Single-mode photonic bandgap guidance of light in air. Science, 285, 1537(1999).
[45] P. J. Roberts, F. Couny, H. Sabert, B. J. Mangan, D. P. Williams, L. Farr, M. W. Mason, A. Tomlinson, T. A. Birks, J. C. Knight, P. St.J. Russell. Ultimate low loss of hollow-core photonic crystal fibers. Opt. Express, 13, 236(2005).
[46] Y. Y. Wang, N. V. Wheeler, F. Couny, P. J. Roberts, F. Benabid. Low loss broadband transmission in hypocycloid-core kagome hollow-core photonic crystal fiber. Opt. Lett., 36, 669(2011).
[47] , . Nested antiresonant nodeless hollow core fiber. Opt. Express, 22, 23807(2014).
[48] Y. Fei, J. C. Knight. Negative curvature hollow core optical fiber. IEEE J. Sel. Top. Quantum Electron., 22, 4400610(2015).
[49] S. F. Gao, Y. Y. Wang, W. Ding, D. L. Jiang, S. Gu, X. Zhang. Hollow-core conjoined-tube negative-curvature fiber with ultralow loss. Nat. Commun., 9, 2828(2018).
[50] Y. Y. Wang, X. Peng, M. Alharbi, C. Fourcade Dutin, T. D. Bradley, F. Gérôme, Mielke Michael, Booth Timothy, F. Benabid. Design and fabrication of hollow-core photonic crystal fibers for high-power ultrashort pulse transportation and pulse compression. Opt. Lett., 37, 3111(2012).
[51] C. M. Smith, N. Venkataraman, M. T. Gallagher, D. Müller, J. A. West, N. F. Borrelli, D. C. Allan, K. W. Koch. Low-loss hollow-core silica/air photonic bandgap fiber. Nature, 424, 657(2003).
[52] F. Couny, F. Benabid, P. S. Light. Large-pitch Kagome-structured hollow-core photonic crystal fiber. Opt. Lett., 31, 3574(2006).
[53] C. He, C. Zhou, Q. Zhou, S. Y. Xie, Y. Yao. Simultaneous measurement of strain and temperature using Fabry–Pérot interferometry and antiresonant mechanism in a hollow-core fiber. Chin. Opt. Lett., 19, 041201(2021).
[54] F. Benabid, F. Couny, J. Knight, T. Birks, P. Russell. Compact, stable and efficient all-fiber gas cells using hollow-core photonic crystal fibers. Nature, 434, 488(2005).
[55] R. Thapa, K. Knabe, K. L. Corwin, B. R. Washburn. Arc fusion splicing of hollow-core photonic bandgap fibers for gas-filled fiber cells. Opt. Express, 14, 9576(2006).
[56] C. J. Hensley, D. H. Broaddus, C. B. Schaf, A. L. Gaeta. Photonic band-gap fiber gas cell fabricated using femtosecond micromachining. Opt. Express, 15, 6690(2007).
[57] G. Epple, K. S. Kleinbach, T. G. Euser, N. Y. Joly, T. Pfau, P. Russell, R. Low. Rydberg atoms in hollow-core photonic crystal fibers. Nat. Commun., 5, 4132(2014).
[58] K. K. Chow, M. Short, S. Lam, A. Mcwilliams, H. Zeng. A Raman cell based on hollow core photonic crystal fiber for human breath analysis. Med. Phys., 41, 092701(2014).
[59] P. S. Light, F. Couny, F. Benabid. Low optical insertion-loss and vacuum-pressure all-fiber acetylene cell based on hollow-core photonic crystal fiber. Opt. Lett., 31, 2538(2006).
[60] M. P. Buric, K. P. Chen, J. Falk, S. D. Woodruff. Enhanced spontaneous Raman scattering and gas composition analysis using a photonic crystal fiber. Appl. Opt., 47, 4255(2008).
[61] L. W. Kornaszewski, N. Gayraud, J. M. Stone, W. N. Macpherson, A. K. George, J. C. Knight. Mid-infrared methane detection in a photonic bandgap fiber using a broadband optical parametric oscillator. Opt. Express, 15, 11219(2007).
[62] J. P. Parry, B. C. Griffiths, N. Gayraud, E. D. Mcnaghten, A. M. Parkes, W. N. Macpherson. Towards practical gas sensing with micro-structured fibers. Meas. Sci. Technol., 20, 075301(2009).
[63] I. Shavrin, S. Novotny, A. Shevchenko, H. Ludvigsen. Gas refractometry using a hollow-core photonic bandgap fiber in a Mach–Zehnder-type interferometer. Appl. Phys. Lett., 100, 051106(2012).
[64] P. C. Zhao, H. L. Ho, W. Jin, S. C. Fan, S. F. Gao, Y. Y. Wang, P. Wang. Gas sensing with mode-phase-difference photothermal spectroscopy assisted by a long period grating in a dual-mode negative-curvature hollow-core optical fiber. Opt. Lett., 45, 5660(2020).
[65] F. F. Chen, S. L. Jiang, W. Jin, H. H. Bao, H. L. Ho, C. Wang, S. F. Gao. Ethane detection with mid-infrared hollow-core fiber photothermal spectroscopy. Opt. Express, 28, 38115(2020).
[66] W. Jin, H. F. Xuan, H. L. Ho. Sensing with hollow-core photonic bandgap fibers. Meas. Sci. Technol., 21, 094014(2010).
[67] Y. Y. Huang, Y. Xu, A. Yariv. Fabrication of functional microstructured optical fibers through a selective-filling technique. Appl. Phys. Lett., 85, 5182(2004).
[68] Z. B. Liu, X. He, D. N. Wang. Passively mode-locked fiber laser based on a hollow-core photonic crystal fiber filled with few-layered graphene oxide solution. Opt. Lett., 36, 3024(2011).
[69] C. Cordeiro, E. Santos, C. Cruz, C. Matos, D. S. Ferreiira. Lateral access to the holes of photonic crystal fibers—selective filling and sensing applications. Opt. Express, 14, 8403(2006).
[70] S. T. Bauerschmidt, D. Novoa, B. M. Trabold, A. Abdolvand, P. Russell. Supercontinuum up-conversion via molecular modulation in gas-filled hollow-core PCF. Opt. Express, 22, 20566(2014).
[71] A. Hoffmann, M. Zürch, C. Spielmann. Extremely nonlinear optics using shaped pulses spectrally broadened in an argon- or sulfur hexafluoride-filled, hollow-core fiber. Appl. Sci., 5, 1310(2015).
[72] D. Yan, J. Popp, M. W. Pletz, T. Frosch. Highly sensitive broadband Raman sensing of antibiotics in step-index hollow-core photonic crystal fibers. ACS Photon., 4, 138(2017).
[73] M. Gebhardt, T. Heuermann, R. Klas, C. Liu, J. Limpert. Bright, high-repetition-rate water window soft x-ray source enabled by nonlinear pulse self-compression in an antiresonant hollow-core fiber. Light: Sci. Appl., 10, 36(2021).
[74] J. H. Wray, J. T. Neu. Refractive index of several glasses as a function of wavelength and temperature. J. Opt. Soc. Am., 59, 774(1969).
[75] B. Kuhn, R. Schadrack. Thermal expansion of synthetic fused silica as a function of OH content and fictive temperature. J. Non-Crystall. Solids, 355, 323(2009).
[76] M. Ferreira, L. Coelho, K. Schuster, J. Kobelke, L. Santos, O. Frazão. Fabry–Perot cavity based on a diaphragm-free hollow-core silica tube. Opt. Lett., 36, 4029(2011).
[77] H. Bae, M. Yu. Miniature Fabry–Perot pressure sensor created by using UV-molding process with an optical fiber-based mold. Opt. Express, 20, 14573(2012).
[78] W. H. Wang, N. Wu, Y. Tian, C. Niezrecki, X. W. Wang. Miniature all-silica optical fiber pressure sensor with an ultrathin uniform diaphragm. Opt. Express, 18, 9006(2010).
[79] F. Xu, D. X. Ren, X. L. Shi, C. Li, W. W. Lu, L. Lu, L. Lu, B. L. Yu. High-sensitivity Fabry–Perot interferometric pressure sensor based on a nanothick silver diaphragm. Opt. Lett., 37, 133(2012).
[80] J. Ma, J. Ju, L. Jin, W. Jin. A compact fiber-tip micro-cavity sensor for high-pressure measurement. IEEE Photon. Technol. Lett., 23, 1561(2011).
[81] J. Ma, W. Jin, H. L. Ho, J. Y. Dai. High-sensitivity fiber-tip pressure sensor with graphene diaphragm. Opt. Lett., 37, 2493(2012).
[82] J. C. Xu, X. W. Wang, K. L. Cooper, A. B. Wang. Miniature all-silica fiber optic pressure and acoustic sensors. Opt. Lett., 30, 3269(2005).
[83] Z. Zhang, C. R. Liao, J. Tang, Z. Y. Bai, K. K. Guo, M. X. Hou, J. He, Y. Wang, S. Liu, F. Zhang, Y. P. Wang. High-sensitivity gas-pressure sensor based on fiber-tip PVC diaphragm Fabry–Perot interferometer. J. Lightwave Technol., 35, 4067(2017).
[84] M. Deng, C. P. Tang, T. Zhu, Y. J. Rao, L. C. Xu, M. Han. Refractive index measurement using photonic crystal fiber-based Fabry–Perot interferometer. Appl. Opt., 49, 1593(2010).
[85] J. Tang, G. L. Yin, C. R. Liao, S. Liu, Z. Y. Li, X. Y. Zhong, Q. Wang, J. Zhao, K. M. Yang, Y. P. Wang. High-sensitivity gas pressure sensor based on Fabry–Perot interferometer with a side-opened channel in hollow-core photonic bandgap fiber. IEEE Photon. J., 7, 2489926(2015).
[86] Y. C. Cao, W. Jin, F. Yang, H. L. Ho. Phase sensitivity of fundamental mode of hollow core photonic bandgap fiber to internal gas pressure. Opt. Express, 22, 13190(2014).
[87] Z. Zhang, J. He, Q. Dong, Z. Y. Bai, C. R. Liao, Y. Wang, S. Liu, K. K. Guo, Y. P. Wang. Diaphragm-free gas-pressure sensor probe based on a hollow-core photonic bandgap fiber. Opt. Lett., 43, 3017(2018).
[88] J. Ma. Miniature Fiber-Tip Fabry–Perot Interferometric Sensors for Pressure and Acoustic Detection(2014).
[89] Y. Jiang. Fourier transform white-light interferometry for the measurement of fiber-optic extrinsic Fabry–Perot interferometric sensors. IEEE Photon. Technol. Lett., 20, 75(2008).
[90] Y. Jiang, C. Tang. Fourier transform white-light interferometry based spatial frequency-division multiplexing of extrinsic Fabry–Perot interferometric sensors. Rev. Sci. Instrum., 79, 106105(2008).


Set citation alerts for the article
Please enter your email address

© Copyright 2018-2021 | Chinese Laser Press. All Rights Reserved 沪ICP备15018463号-20