
Xing Peng, Lingbao Kong, "Design of a real-time fiber-optic infrared imaging system with wide-angle and large depth of field," Chin. Opt. Lett. 20, 011201 (2022)
- Chinese Optics Letters
- Vol. 20, Issue 1, 011201 (2022)
Abstract
Keywords
1. Introduction
Over the past 5 years, the prevalence and incidence of heart disease have risen due to the longevity of the population, creating a great economic burden for society[
Angioscopy is an endoscopic imaging system[
Visualization through blood has continuously been the subject of intensive investigations[
Sign up for Chinese Optics Letters TOC. Get the latest issue of Chinese Optics Letters delivered right to you!Sign up now
With the development of multimodal imaging capabilities and miniaturization of fiber-based devices, fiber-optic endoscopic probes have enabled breakthroughs in medical imaging due to their ability to reach deep into the human body[
In this paper, a real-time fiber-optic infrared imaging system, named RFIS, has been proposed. We focused on improving the optical structure of the RFIS for wide FOV and large DOF with high relative illuminance over all of the fields. This paper is organized as follows. The design concept and specification are described in Section 2. In Section 3, experiments and analyses of the optical properties are presented. Section 4 illustrates the tolerance analysis, and then the conclusion is presented in Section 5.
2. Design Concept and Specification
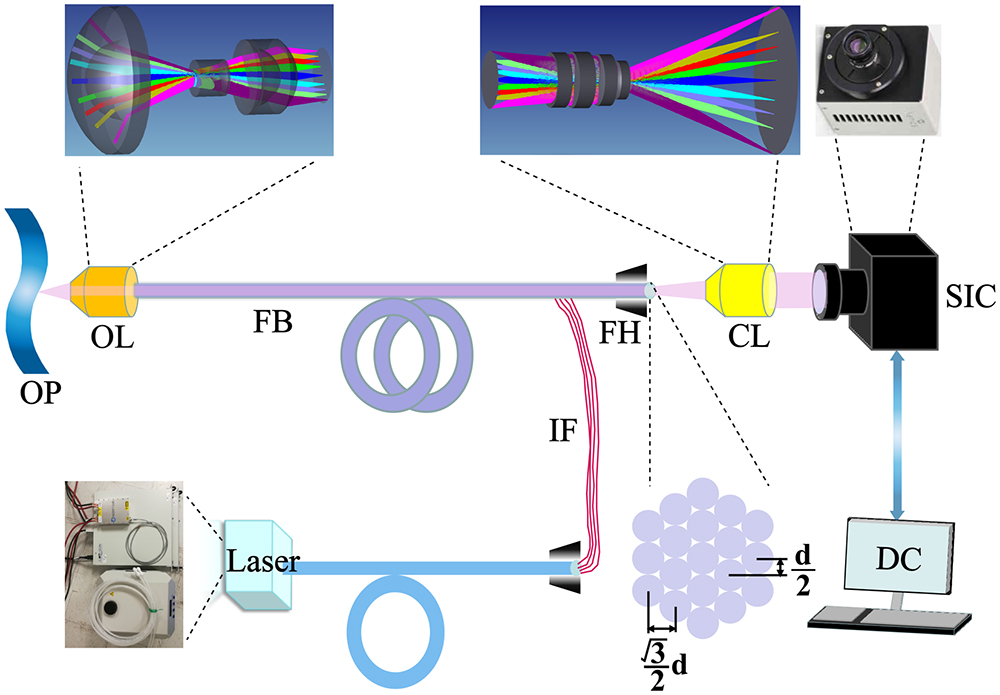
The conceptual system diagram is shown in Fig. 1. The RFIS is designed to simultaneously achieve both wide FOV and large DOF infrared imaging with high quality. The RFIS mainly includes an objective lens (OL), laser source, fiber bundle, coupling lens (CL), illuminance fibers, short wavelength infrared (SWIR) camera, and display device. The RFIS is designed with optimized structures so that a compact diameter package could be adapted for housing the OL and CL along with the fiber bundle; this facilitates the rapid adoption of the developed technique for clinical application. The light source is from a laser source (ES-7700-0001, QPC Lasers). The imaging fiber bundle (A2 Fiber, SCHOTT) has a high numerical aperture (NA) of 0.22, a section diameter of 3 mm with 10,000 optical fibers, and a single-core diameter of 27.5 µm, which makes it greatly suited to be coupled to the optical device. The order packing structure of the fiber bundle is a hexagonal structure, and the maximum spatial resolution of the fiber bundle is 21 lp/mm. The sensitive area of the SWIR camera (Xeva-2.5-320, Xenics) is
![]()
Figure 1.Schematic diagram of the real-time fiber-optic infrared system (RFIS) with a large DOF. OP, objective plane; OL, objective lens; FB, fiber bundle; IF, illuminance fibers; CL, coupling lens; SIC, SWIR camera; DC, display and control.
The fiber bundle acquires real-time imaging of the diseased areas through an OL and projects the images to the SWIR camera through the CL during the surgery. Additionally, the designed system is optimized for a wide FOV of 120° and a long working distance (WD) of 8 to 25 mm. Thus, the efficiency of intracardiac visualization and surgery can be improved significantly.
3. Experiments and Analysis of the RFIS
The optical design of the RFIS system was quite challenging due to the wide FOV, large DOF, limited lens diameter, high relative illuminance, and telecentric requirements in addition to the need to match different optical components.
3.1. Objective lens design and evaluation
Figure 2(a) shows the cross-sectional schematic of the OL. As shown in Table 1, the OL was designed to have a focal length of 0.797 mm, an F-number of three, a total track length of 13.32 mm, and an FOV of 120°. Generally, the image space NA in the OL should match the acceptance NA in the fiber bundle to ensure that the incident rays that are both on the axis and outside the axis symmetrical to the chief rays can project from the fiber bundle without loss. The telecentric optical structure provides constant image magnification regardless of the object and/or image position, eliminating the perspective angle error[
| Item | Result |
|---|---|
| Field of view (°) | 120 |
| Focal length (mm) | 0.797 |
| Working distance (mm) | 10 |
| Half-image height (mm) | 1.5 |
| Total track length (mm) | 13.32 |
| Relative illumination | |
| MTF |
Table 1. Specification of the OL
![]()
Figure 2.Optical imaging quality evaluation of the RFIS. (a) Cross-sectional schematic of the OL in the RFIS. (b) Diffraction MTF values. (c) Field curvature and distortion plot. (d) Geometric spot diagrams. (e) Relative illuminance (RI) curve. (f) Wavefront map at FOV of 60°.
Figure 2(d) shows the spot diagram of the OL. Different colors in the spot patterns indicate the different wavelengths, including 1.2 µm, 1.5 µm, and 1.8 µm. These spots are scaled with the Airy disk at 1.5 µm (dark circle), whose radius is
3.2. Coupling lens design and evaluation
Figure 3(a) shows the cross-sectional schematic of the CL. To meet the condition where the incident beam of the fiber bundle can be collected perfectly by the CL without loss, the CL was designed with a telecentric structure in the object space. As presented in Table 2, the designed CL has a focal length of 4.370 mm, the NA in the object space is 0.25, and the FOV is 28.95°. Figure 3(b) presents the MTF of the CL. The cutoff frequency is calculated to be 16.7 lp/mm, and all of the fields at 16.7 lp/mm are above 0.661. The high flatness of the optimized MTF demonstrates that a high uniformity can be obtained for the CL.
| Item | Result |
|---|---|
| Field of view (°) | 28.95 |
| Focal length (mm) | 4.370 |
| NA in objective space | 0.25 |
| Half-image height (mm) | 6.15 |
| Relative illumination | |
| MTF |
Table 2. Specification of the CL
![]()
Figure 3.Optical imaging quality evaluation of the RFIS. (a) Cross-sectional schematic of the CL in the RFIS. (b) Diffraction MTF values. (c) Field curvature and distortion plot. (d) Geometric spot diagrams. (e) RI curve. (f) Wavefront map at an FOV of 14.475°.
To further improve the optical imaging performance of the RFIS, the system was optimized at three different WDs to cover a feasibly large DOF. The largest WD for optimization is set at 25 mm, which is larger than the design requirements. The objective space is filled with blood. The optimization results are shown in Fig. 4 and consist of three WDs of 8, 15, and 25 mm covering five fields. The RFIS has good contrast over most of the field at 21 lp/mm, and the MTF values are above 0.74 when the WDs are 8 and 15 mm, respectively. Additionally, when the WD is 25 mm, the MTF values are above 0.7. The relative illuminance values are higher than 0.95 in all fields, the RMS values of the spot radius are below 10.492 µm, and the distortion of all configurations is less than
![]()
Figure 4.MTF curves of the systems with different WDs for five radial image positions: on-axis, 0.3 field, 0.5 field, 0.707 field, and full field. (a) WD = 8 mm. (b) WD = 15 mm. (c) WD = 25 mm.
4. Distortion Correction of the RFIS
To further demonstrate the feasibility of the RFIS, we imaged the USAF 1951 resolution board in Zemax. The test image has a nominal WD of 10 mm, and the result is shown in Fig. 5(b), where the details of the center and edge of the detection areas can be observed. Meanwhile, the distortion appears in the wide-angle optical system inevitably, and it is complicated to reduce distortion while still maintaining a wide FOV[
![]()
Figure 5.Optical imaging results for evaluating the imaging quality of the RFIS. (a) The original image is a USAF 1951 resolution board. (b) The simulation image of the RFIS. (c) The undistorted image after computer processing with the distortion correction algorithm of image (b).
5. Tolerance Analysis
From the preceding analysis, we designed an RFIS that can meet the specification and possesses good optical quality. However, the feasibility of manufacturing needs to be confirmed through a tolerance analysis[
Table 3 presents the tolerance distribution for the OL and CL. Figure 6(a) shows the tolerance analysis results for different surfaces of the OL. TSDY denotes the decentration of the surface. TEDY represents the decentration of the lens in the Y direction. The TSDY values for surfaces 8 and 9 and the TEDY values for surfaces 4 to 6 have a great effect on the performance of the MTF, while all of the top ten changes in the MTF drop are less than 0.1. The results indicate that the surface decentration control is the most significant factor to control so that a high optical imaging quality for the OL can be obtained. Furthermore, the Monte Carlo analysis was performed in different fields. As shown in Fig. 6(b), the analysis results indicate that the MTF is greater than 0.76, 0.73, and 0.71, with a possibility of obtaining 90% in the central field, 0.3 field, and 0.5 field, respectively. Additionally, for 0.707 field and the full field, the MTF can only be maintained above 0.61 and 0.43, respectively, in different fields. As shown in Fig. 6(b), the analysis results indicate that the MTF is greater than 0.76, 0.73, and 0.71, with a possibility of obtaining 90% in the central field, 0.3 field, and 0.5 field, respectively. Moreover, Fig. 6(c) presents the tolerance analysis results of the CL, and the Monte Carlo results are shown in Fig. 6(d). TFRN denotes the radius tolerance, TTHI represents the thickness tolerance, and TIRY represents the inclination of the surfaces in the Y direction. The results show that the TFRN value for surface 9 and the TSDY value for surface 9 mostly affect the MTF drop, while the MTF is greater than 0.61 with a possibility of 90% in the central field, 0.58 for the 0.5 field, and 0.53 for the 0.707 field with a possibility of 90%. Therefore, we have achieved a reasonable MTF for the manufacturing and assembly tolerances of the designed RFIS. Furthermore, all of the elements are designed to be spherical, which greatly saves the manufacturing cost and reduces the processing time.
![]()
Figure 6.Tolerance analysis and Monte Carlo analysis. (a) Tolerance analysis results of the OL. (b) The Monte Carlo analysis results of the OL. (c) Tolerance analysis results of the CL. (d) The Monte Carlo analysis results of the CL.
| Tolerance Item | OL Value | CL Value |
|---|---|---|
| Radius (fringe) | ||
| Thickness (mm) | ||
| Surface decenter (mm) | ||
| Element tilt (°) | ||
| Element decenter (mm) | ||
| Surface irregularity | ||
| Refractive index | ||
| Abbe number (%) |
Table 3. Tolerance Value of the RFIS
To further demonstrate the feasibility of the RFIS in imaging biological tissue through blood, we performed an imaging simulation to see the change in image quality. The corresponding gross anatomy of the tricuspid valve in a postmortem examination from Ref. [21] and the tricuspid valve from an autopsy of the right ventricle from Ref. [32] was simulated. The test images have a nominal WD of 10 mm, and the results are shown in Figs. 7(a) and 7(c), respectively, where the details of the center and edge of the detection areas can be observed. Meanwhile, the distortion appears in the wide-angle optical system inevitably, and it is complicated to reduce distortion while still maintaining a wide FOV. As seen in Figs. 7(b) and 7(d), the distortion is corrected effectively by the image processing algorithm in real time.
![]()
Figure 7.Optical imaging results for evaluating the imaging quality of the RFIS. (a) The original image shows the corresponding gross anatomy of the tricuspid valve in a postmortem examination[
6. Conclusion
The design of an RFIS is presented in this paper, which mainly includes OL, fiber bundle, CL, laser source, display device, SWIR camera, and illuminance fibers. The RFIS performs well with wide FOVs, large DOFs, and high relative illuminance in the overall fields. Firstly, the experiments and analysis of the RFIS are performed by the software of Zemax. The assessment criteria of the imaging quality for the OL and CL, such as MTF values, spot diagram, and relative illuminance, have been comprehensively optimized and analyzed. Then, we further evaluate the performance of the RFIS with different WDs, and the results demonstrate a large DOF of the designed system. Moreover, to confirm the feasibility of manufacturing and assembly, tolerance and Monte Carlo analyses have been performed, further guaranteeing the rapid adoption of the developed technique for clinical application. Finally, we simulate and evaluate the imaging quality, and the distortion is corrected effectively by the image processing algorithm in real time. Therefore, the proposed RFIS can achieve a large WD of 8 to 25 mm, a wide FOV of 120°, and the relative illuminance is over 0.98 in the overall FOV.
References
[1] T. M. Hartjes, D. Lester. Minimally invasive surgical options with valvular heart disease. Crit. Care. Nurs. Clin. N. Am., 31, 257(2019).
[2] D. Vervoot, B. Meuris, B. Meyns, P. Verbrugghe. Global cardiac surgery: access to cardiac surgical care around the world. J. Thorac. Cardiovasc. Surg., 159, 987(2019).
[3] R. M. Easterwood, I. C. Bostock, S. Nammalwar, J. N. McCullough, A. Iribarne. The evolution of minimally invasive cardiac surgery: from minimal access to transcatheter approaches. Future Cardiol., 14, 75(2018).
[4] I. Martišienė, D. Karčiauskas, A. Navalinskas, R. Mačianskienė, A. Kučinskas, R. Treinys, R. Grigalevičiūtė, V. Zigmantaitė, L. Ralienė, R. Benetis, J. Jurevičius. Optical mapping of the pig heart in situ under artificial blood circulation. Sci. Rep., 10, 8548(2020).
[5] J. Shin, D. N. Tran, J. R. Stroud, S. Chin, T. D. Tran, M. A. Foster. A minimally invasive lens-free computational microendoscope. Sci. Adv., 6, 43(2020).
[6] J. Yoon, J. Joseph, D. J. Waterhouse, A. S. Luthman, G. S. D. Gordon, M. D. Pietro, W. Januszewicz, R. C. Fitzgerald, S. E. Bohndiek. A clinically translatable hyperspectral endoscopy (HySE) system for imaging the gastrointestinal tract. Nat. Commun., 10, 1902(2019).
[7] H. Lee, Y. Lee, C. Song, H. R. Cho, R. Ghaffari, T. K. Choi, K. H. Kim, Y. B. Lee, D. Ling, H. Lee, S. J. Yu, S. H. Choi, T. Hyeon, D. H. Kim. An endoscope with integrated transparent bioelectronics and theranostic nanoparticles for colon cancer treatment. Nat. Commun., 6, 10059(2015).
[8] Z. Yu, Z. Ju, X. Zhang, Z. Meng, F. Yin, K. Xu. High-speed multimode fiber imaging system based on conditional generative adversarial network. Chin. Opt. Lett., 19, 081101(2021).
[9] X. Wang, K. Xiong, X. Jin, S. Yang. Tomography-assisted Doppler photoacoustic microscopy: proof of concept. Chin. Opt. Lett., 18, 101702(2020).
[10] L. Fu, A. Jain, C. Cranfield, H. Xie, M. Gu. Three-dimensional nonlinear optical endoscopy. J. Biomed. Opt., 12, 4(2007).
[11] G. Fruhwirth, S. Ameer-Beg, R. Cook, T. Watson, T. Ng, F. Festy. Fluorescence lifetime endoscopy using TCSPC for the measurement of FRET in live cells. Opt. Express, 18, 11148(2010).
[12] G. Matz, B. Messerschmidt, W. Göbel, S. Filser, C. S. Betz, M. Kirsch, O. Uckermann, M. Kunze, S. Flämig, A. Ehrhardt, K. M. Irion, M. Haack, M. M. Dorostkar, J. Herms, H. Gross. Chip-on-the-tip compact flexible endoscopic epifluorescence video-microscope for in-vivo imaging in medicine and biomedical research. Biomed. Opt. Express, 8, 3329(2017).
[13] K. Liang, G. Traverso, H. C. Lee, O. O. Wang, Z. Potsaid, B. Giacomelli, M. Jayaraman, V. Barman, R. Cable, A. Mashimo, H. Langer, R. Fujimoto, G. James. Ultrahigh speed en face OCT capsule for endoscopic imaging. Biomed. Opt. Express, 6, 1146(2015).
[14] H. C. Park, H. Guan, A. Li, Y. Yue, M. Li, H. Lu, X. Li. High-speed fiber-optic scanning nonlinear endomicroscopy for imaging neuron dynamics in vivo. Opt. Lett., 45, 13(2020).
[15] M. T. Myaing, D. J. MacDonald, X. D. Li. Fiber-optic scanning two-photon fluorescence endoscope. Opt. Lett., 31, 1076(2006).
[16] F. H. Cai, Y. L. Wang, M. Gao, S. L. He. The design and implementation of a low-cost multispectral endoscopy through galvo scanning of a fiber bundle. Opt. Commun., 428, 1(2018).
[17] G. Lu, B. Fei. Medical hyperspectral imaging: a review. Biomed. Opt. Express, 19, 10901(2014).
[18] A. Ataollahi, I. Berra, N. V. Vasilyev, Z. Machaidze, P. E. Dupont. Cardioscopic tool-delivery instrument for beating-heart surgery. IEEE ASME Trans. Mechatron., 21, 584(2016).
[19] M. J. Suter, S. K. Nadkarni, G. Weisz, A. Tanaka, F. A. Jaffer, B. E. Bouma, G. J. Tearney. Intravascular optical imaging technology for investigating the coronary artery,”. JACC: Cardiovasc. Imaging, 4, 1022(2011).
[20] P. Eshtehardi, J. Luke, M. C. McDaniel, H. Samady. Intravascular imaging tools in the cardiac catheterization laboratory: comprehensive assessment of anatomy and physiology. J. Cardiovasc. Trans. Res., 4, 393(2011).
[21] W. S. Grundfest, J. Val-Mejias, E. Monnet, B. P. Knight, S. Nazarian, R. D. Berger, T. B. Ferguson, M. M. Roden, D. Amundson, J. Hanlin, L. Blankenship. Real-time percutaneous optical imaging of anatomical structures in the heart through blood using a catheter-based infrared imaging system. Semin Thorac Cardiovasc Surg., 19, 336(2007).
[22] J. Bec, C. Li, L. Marcu. Broadband, freeform focusing micro-optics for a side-viewing imaging catheter. Opt. Lett., 44, 4961(2019).
[23] V. Tsvirkun, S. Sivakutty, G. Bouwmans. Widefield lensless endoscopy with a multicore fiber. Opt. Lett., 41, 4771(2016).
[24] A. Mikš, J. Novák. Design of a double-sided telecentric zoom lens. Appl. Opt., 51, 24(2012).
[25] G. P. Lan, T. F. Mauger, G. Q. Li. Design of high-performance adaptive objective lens with large optical depth scanning range for ultrabroad near infrared microscopic imaging. Biomed. Opt. Express, 6, 3362(2015).
[26] X. Yu, C. Liu, Y. J. Zhang, H. Xu, Y. Wang, W. Yu. Multispectral curved compound eye camera. Opt. Express, 28, 9216(2020).
[27] D. Cheng, Y. T. Wang, L. Yu, X. H. Liu. Optical design and evaluation of a 4 mm cost-effective ultra-high-definition arthroscope. Biomed. Opt. Express, 5, 2697(2014).
[28] Q. Zhou, Y. H. Tian, J. H. Wang, M. Xu. Design and implementation of a high-performance panoramic annular lens. Appl. Opt., 59, E36(2020).
[29] S. Chang, D. Kim, H. S. Kwon. Compact wide-angle capsule endoscopic lens design. Appl. Opt., 59, 3595(2020).
[30] P. Y. Zhou, L. B. Kong, J. H. Wang, M. Xu. Development of a light field measuring system with corrected distortion based on imaging analysis. Appl. Opt., 59, G24(2020).
[31] X. Zeng. Configuration optimization of off-axis parabolic mirror for enhancing the focusability of a laser beam. Chin. Opt. Lett., 19, 032601(2021).
[32] A. Shiose, T. Takaseya, H. Fumoto, T. Horai, H. Kim, K. Fukamachi, T. Mihaljevic. Cardioscopy-guided surgery: intracardiac mitral and tricuspid valve repair under direct visualization in the beating heart. J. Thorac. Cardiovasc. Surg., 142, 199(2011).


Set citation alerts for the article
Please enter your email address

© Copyright 2018-2021 | Chinese Laser Press. All Rights Reserved 沪ICP备15018463号-20