
Cong Tang, Yongshun Ling, Hua Yang, Xing Yang, Wuqin Tong. Decision-Level Fusion Tracking for Infrared and Visible Spectra Based on Deep Learning[J]. Laser & Optoelectronics Progress, 2019, 56(7): 071502
- Laser & Optoelectronics Progress
- Vol. 56, Issue 7, 071502 (2019)
![Tracking drift using several classic tracking methods. (a) Algorithm in Ref. [9]; (b) algorithm in Ref. [14]; (c) algorithm in Ref. [15]; (d) algorithm in Ref. [16]](/richHtml/lop/2019/56/7/071502/img_1.jpg)
Fig. 1. Tracking drift using several classic tracking methods. (a) Algorithm in Ref. [9]; (b) algorithm in Ref. [14]; (c) algorithm in Ref. [15]; (d) algorithm in Ref. [16]
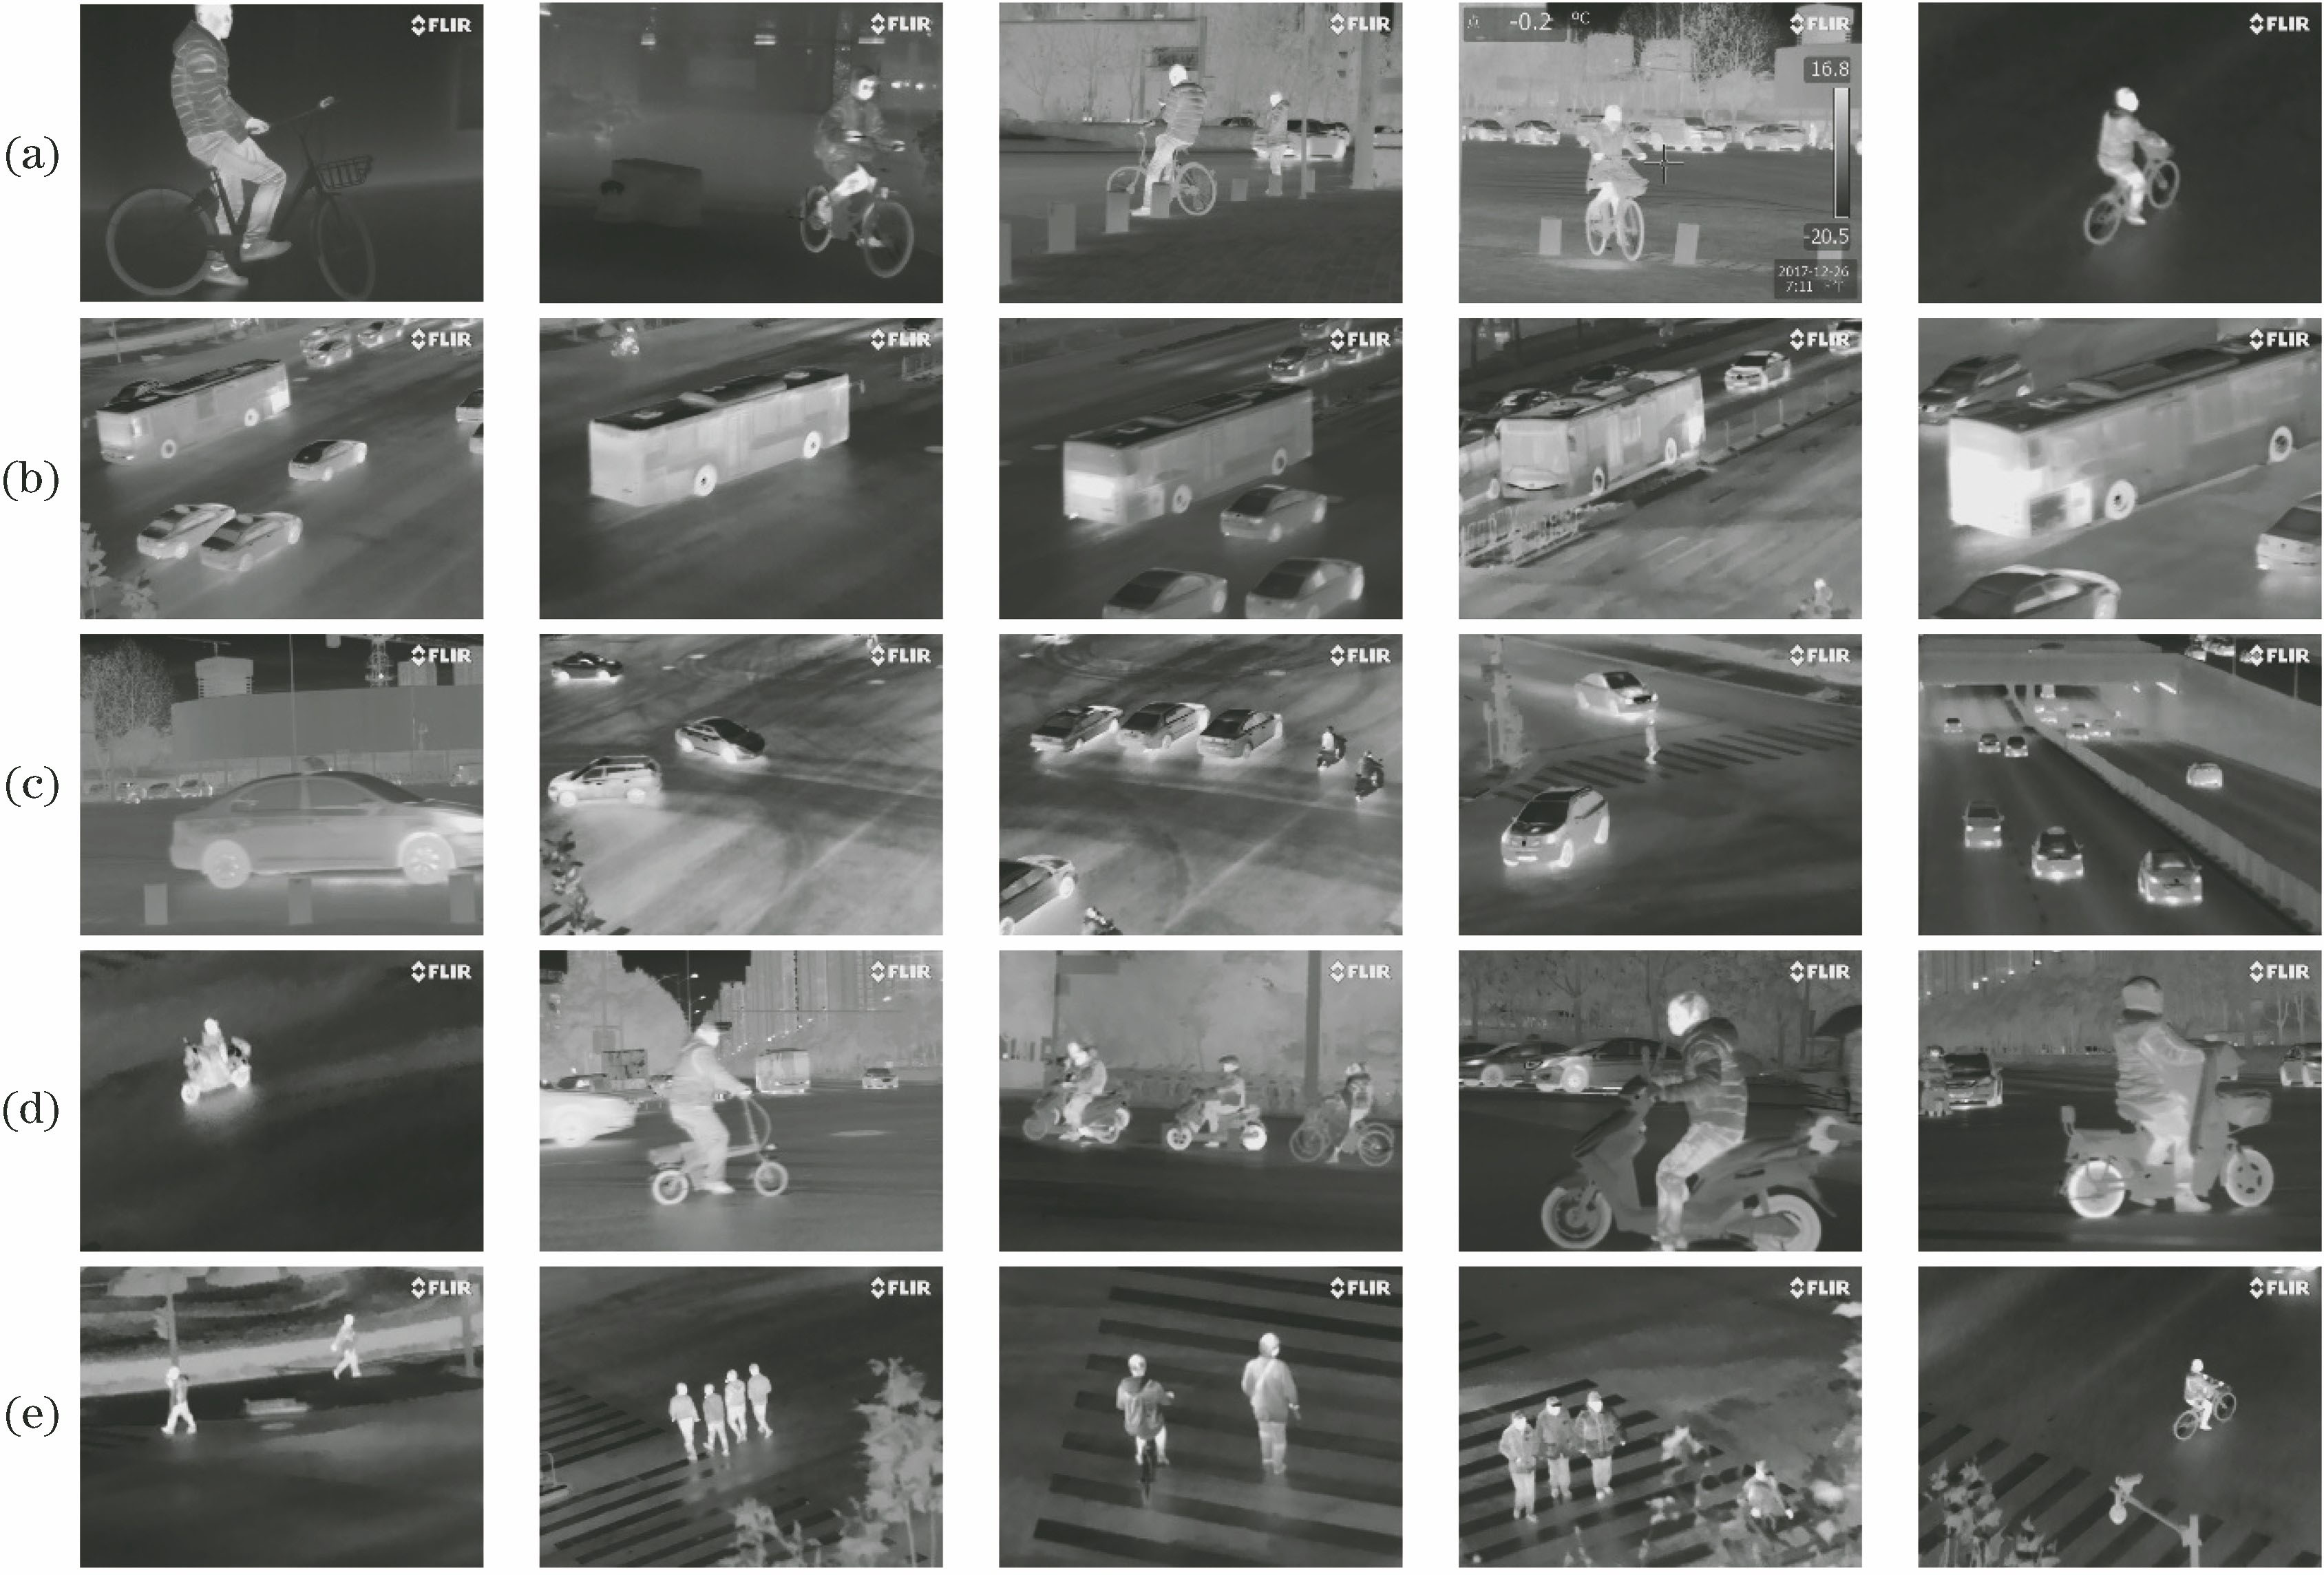
Fig. 2. Infrared images dataset (examples). (a) Bicycle; (b) bus; (c) car; (d) motorbike; (e) pedestrian
Fig. 3. Training loss versus number of iterations
Fig. 4. Test accuracy versus number of iterations
Fig. 5. Decision-level fusion tracking for infrared and visible spectra based on deep learning
Fig. 6. Process of decision-level fusion tracking
Fig. 7. Tracking results(frame sequence number is 1, 15, 32, 55, 129, 143, 162). (a) Infrared tracking; (b) visible tracking; (c) fusion tracking infrared and visible
Fig. 8. Comparison of overlap score between dual-band fusion and single band tracking
Fig. 9. Comparison of centre location error between dual-band fusion and single band tracking
| |||||||||||||||||
Table 1. mAP of five classes on infrared test datasets
|
Table 2. Performance comparison between dual-band fusion tracking and single band tracking


Set citation alerts for the article
Please enter your email address

© Copyright 2018-2021 | Chinese Laser Press. All Rights Reserved 沪ICP备15018463号-20