• Spectroscopy and Spectral Analysis
  • Vol. 42, Issue 7, 2297 (2022)
Meng-jun ZHANG1、*, Li-li LIU1、1; *;, Xie-li YANG2、2;, Jing-fang GUO1、1;, and Hao-yang WANG1、1;
Author Affiliations
  • 11. College of Food and Bioengineering, National Experimental Teaching Demonstration Center for Food Processing and Security, Food Microbiology Engineering Technology Research Center of Henan Province, Research and Utilization of Functional Food Resources Science and Technology Innovation Team of Henan Provincial Department of Education, Luoyang 471023, China
  • 22. LIZHENG College, Henan University of Science and Technology, Luoyang 471023, China
  • show less
    DOI: 10.3964/j.issn.1000-0593(2022)07-2297-07 Cite this Article
    Meng-jun ZHANG, Li-li LIU, Xie-li YANG, Jing-fang GUO, Hao-yang WANG. Multispectral Analysis of Interaction Between Catechins and Egg Yolk Immunoglobulin and the Change of Bacteriostasis[J]. Spectroscopy and Spectral Analysis, 2022, 42(7): 2297 Copy Citation Text show less
    Ultraviolet-visible spectrum of different concentrations of catechins binding to IgYThe mass concentration of IgY was 0.5 mg·mL-1; The mass concentrations of 1 to 5 catechins were 0, 6.25, 12.5, 18.75, 25 μg·mL-1, respectively, as shown in Figure 2
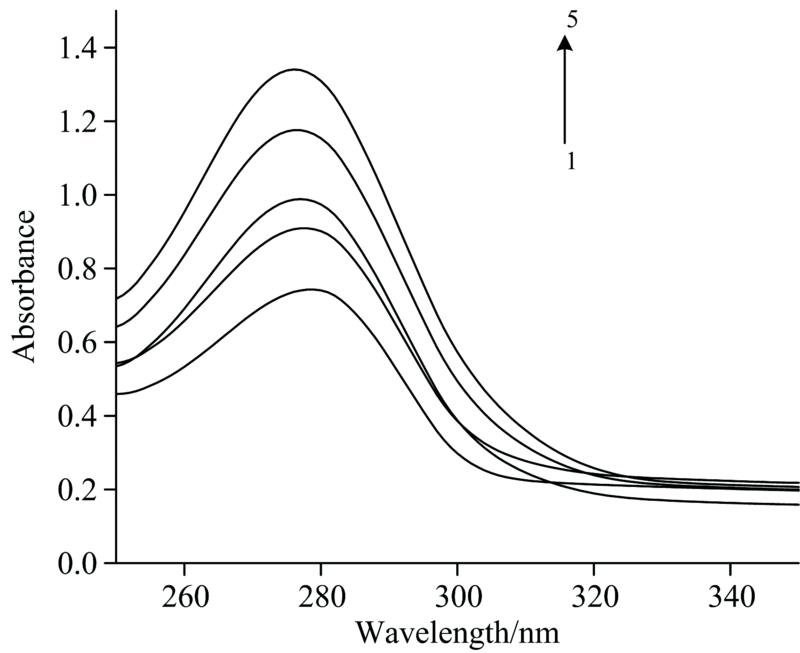
    Fig. 1. Ultraviolet-visible spectrum of different concentrations of catechins binding to IgY
    The mass concentration of IgY was 0.5 mg·mL-1; The mass concentrations of 1 to 5 catechins were 0, 6.25, 12.5, 18.75, 25 μg·mL-1, respectively, as shown in Figure 2
    Fluorescence spectra of different concentrations of catechins and different temperature binding to IgY(a): 18 ℃; (b): 25 ℃; (c): 37 ℃
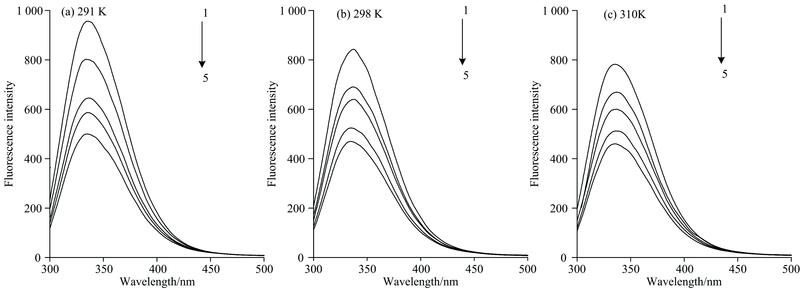
    Fig. 2. Fluorescence spectra of different concentrations of catechins and different temperature binding to IgY
    (a): 18 ℃; (b): 25 ℃; (c): 37 ℃
    Stern-Volmer plots of IgY quenched by catechinat different temperatures
    Fig. 3. Stern-Volmer plots of IgY quenched by catechinat different temperatures
    Logarithmic diagram of IgY-catechin complexes at different temperatures
    Fig. 4. Logarithmic diagram of IgY-catechin complexes at different temperatures
    Fourier transform infrared spectra of IgY and IgY-catechins complex
    Fig. 5. Fourier transform infrared spectra of IgY and IgY-catechins complex
    Antibacterial effect of IgY, mixture and IgY-catechin complex
    Fig. 6. Antibacterial effect of IgY, mixture and IgY-catechin complex
    温度/
    K
    Ksv/
    (L·mol-1)
    Kq/
    [L·(mol·s)-1]
    R2
    2911.053×1041.053×10120.989 9
    2980.934×1040.934×10120.982 0
    3100.818×1040.818×10120.992 6
    Table 1. Quenching rate constants and correlation coefficients of catechin and IgY
    温度/KKA/(L·mol-1)nR2
    2912.455×1041.0890.979
    2981.694×1041.0670.961
    3101.183×1041.0420.984
    Table 2. Apparent binding constant, number of binding sites and linear correlation coefficient of catechin-IgY complex
    温度/
    K
    ΔH/
    (kJ·mol-1)
    ΔG/
    (kJ·mol-1)
    ΔS/
    (J·K-1)
    291-24.456-47.282
    298-38.215-24.125-47.282
    310-24.171-45.303
    Table 3. Thermodynamic parameters of catechin-IgY complex
    样品β-折叠
    /%
    无规卷曲
    /%
    α-螺旋
    /%
    β-转角
    /%
    IgY42.8123.1219.6814.39
    复合物42.5317.8425.1614.47
    Table 4. The relative content of secondary structure of protein in amide Ⅰ band of IgY and IgY-catechin complex
    菌种样品抑菌率/%
    0.025 mg·mL-10.05 mg·mL-10.1 mg·mL-10.15 mg·mL-10.2 mg·mL-1
    IgY22.08±0.86 b23.98±0.44 b29.88±0.21 b30.75±0.11 b32.11±1.15 b
    大肠杆菌混合物27.60±0.68 a29.07±1.03 a29.48±0.73 b31.17±0.17 b34.26±0.40 b
    复合物22.33±0.86 b24.38±0.82 b34.14±0.21 a35.41±0.62 a37.83±0.76 a
    IgY24.97±1.27 c24.85±0.91 c26.99±1.13 c41.85±1.86 c54.49±1.53 c
    金黄色葡萄球菌混合物61.58±1.20 b67.19±0.29 b68.01±0.13 b70.46±1.16 b74.12±0.25 b
    复合物68.29±0.30 a72.16±0.83 a75.06±0.49 a79.15±0.29 a80.79±1.12 a
    Table 5. Bacteriostatic rate of IgY, mixture and IgY-catechin complex
    Meng-jun ZHANG, Li-li LIU, Xie-li YANG, Jing-fang GUO, Hao-yang WANG. Multispectral Analysis of Interaction Between Catechins and Egg Yolk Immunoglobulin and the Change of Bacteriostasis[J]. Spectroscopy and Spectral Analysis, 2022, 42(7): 2297
    Download Citation