
Mengqi Han, Wenjing Chen. Improving Measurement Accuracy of Two-Dimensional S-Transform Profilometry[J]. Acta Optica Sinica, 2019, 39(10): 1012001
- Acta Optica Sinica
- Vol. 39, Issue 10, 1012001 (2019)
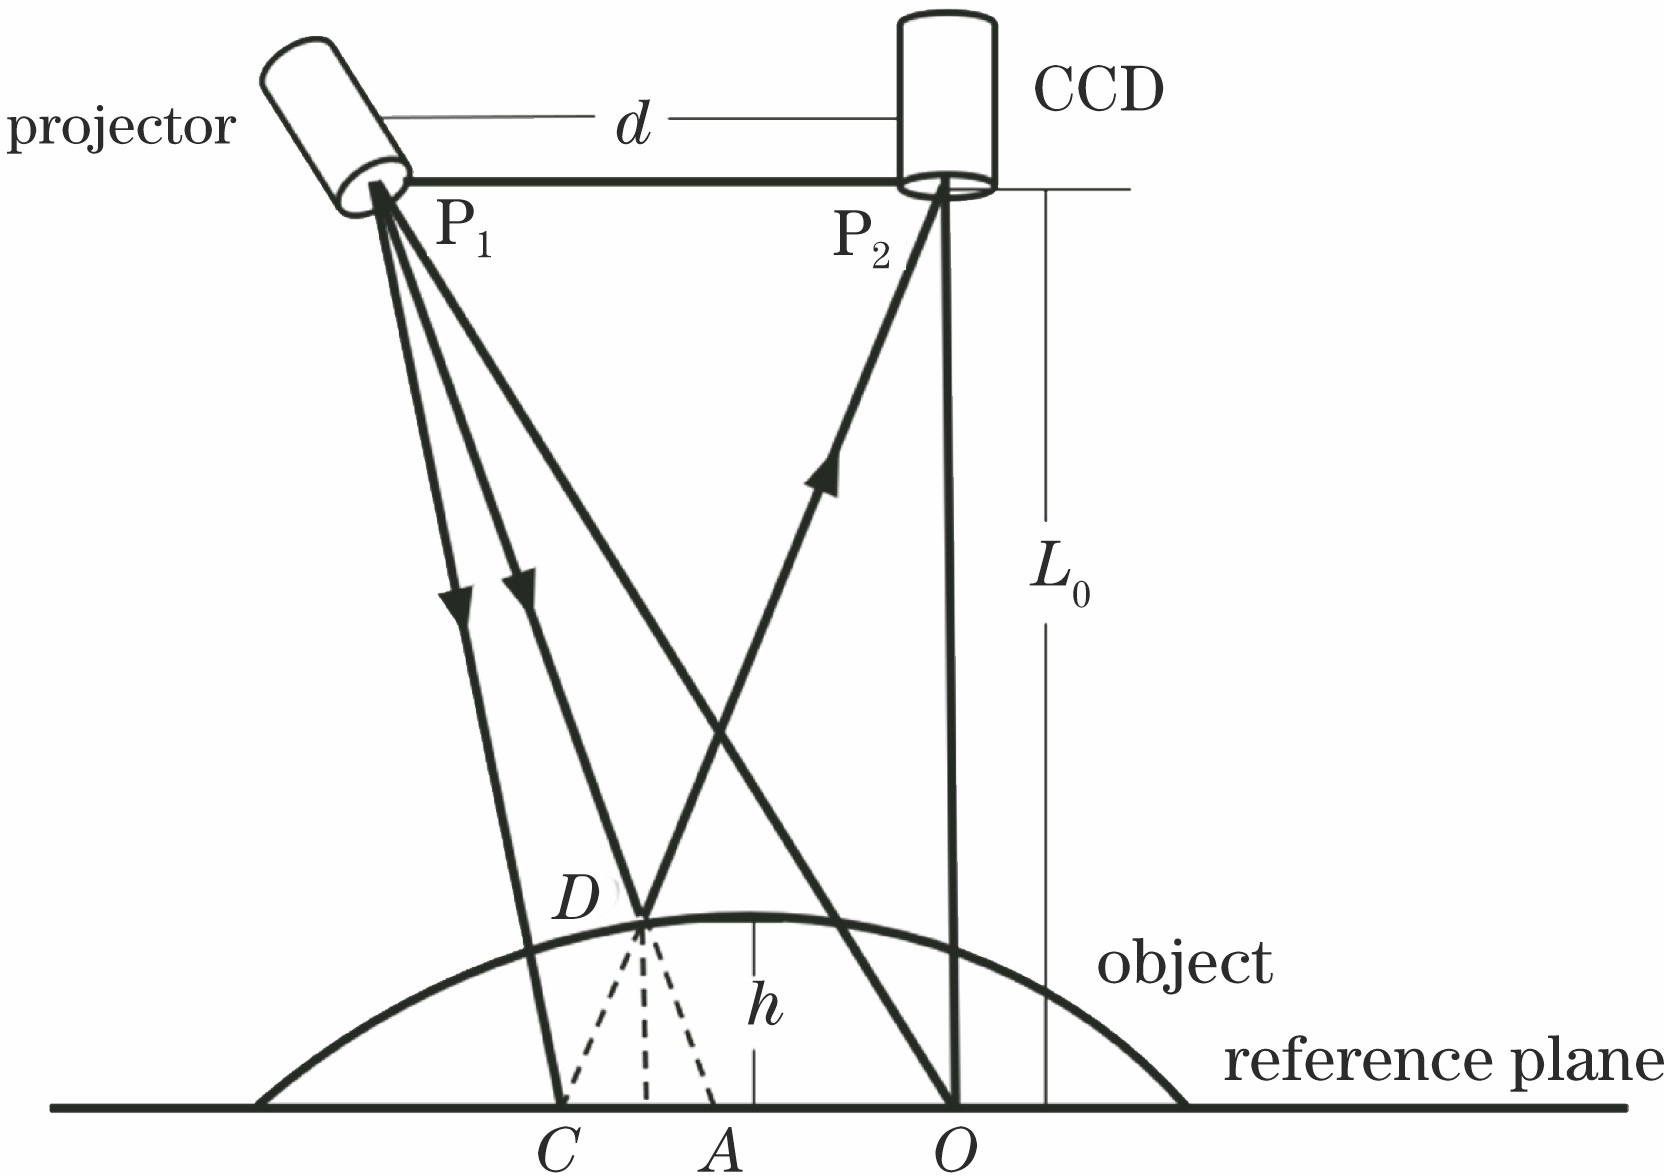
Fig. 1. Schematic of measurement geometry

Fig. 2. Curve-fitting processing. (a) One line of fringes; (b) upper and lower envelopes of fringes obtained by extreme points; (c) background-eliminated fringes
Fig. 3. Piecewise-mean processing. (a) One line of piecewise fringes; (b) fringes after piecewise fitting; (c) background-eliminated fringes
Fig. 4. Simulated object and fringes. (a) Deformed fringes; (b) simulated object
Fig. 5. Reconstructed object by global-mean processing and reconstruction error. (a) Reconstructed object; (b) reconstruction error
Fig. 6. Reconstructed object by curve-fitting processing and reconstruction error. (a) Reconstructed object; (b) reconstruction error
Fig. 7. Reconstructed object by piecewise-mean processing and reconstruction error. (a) Reconstructed object; (b) reconstruction error
Fig. 8. Reconstructed object by one-adjusting-factor processing and reconstruction error. (a) Reconstructed object; (b) reconstruction error
Fig. 9. Reconstructed object by two-adjusting-factor processing and reconstruction error. (a) Reconstructed object; (b) reconstruction error
Fig. 10. Reconstructed object with uncorrected phase and reconstruction error. (a) Reconstructed object; (b) reconstruction error
Fig. 11. Reconstructed object with second-order corrected phase and reconstruction error. (a) Reconstructed object; (b) reconstruction error
Fig. 12. Experiment. (a) Reference fringes; (b) deformed fringes
Fig. 13. Reconstructions by multiple methods. (a) Reconstruction by Fourier transform; (b) reconstruction by global mean; (c) reconstruction by curve fitting; (d) reconstruction by piecewise mean; (e) reconstruction by one adjusting factor; (f) reconstruction by two adjusting factors
Fig. 14. Errors of reconstructions by multiple methods. (a) Reconstruction error by Fourier transform; (b) reconstruction error by global mean; (c) reconstruction error by curve fitting; (d) reconstruction error by piecewise mean; (e) reconstruction error by one adjusting factor; (f) reconstruction error by two adjusting factors
Fig. 15. Detailed comparisons. (a) Line 220 reconstructed surface; (b) magnification of local detail
|
Table 1. Comparison of results by several methods
|
Table 2. Comparison of results before and after second-order phase correction
|
Table 3. Standard deviation between multiple methods and PMP

Set citation alerts for the article
Please enter your email address
© Copyright 2018-2021 | Chinese Laser Press. All Rights Reserved 沪ICP备15018463号-20