
Xiaoqian Gao, Fan Yang, Hairui Fan, Hongyu Zhu, Xuejiao Li. Remote Sensing Image S-Type Fusion/Stitching via Low-Error Matching Strategy[J]. Laser & Optoelectronics Progress, 2019, 56(21): 211005
- Laser & Optoelectronics Progress
- Vol. 56, Issue 21, 211005 (2019)
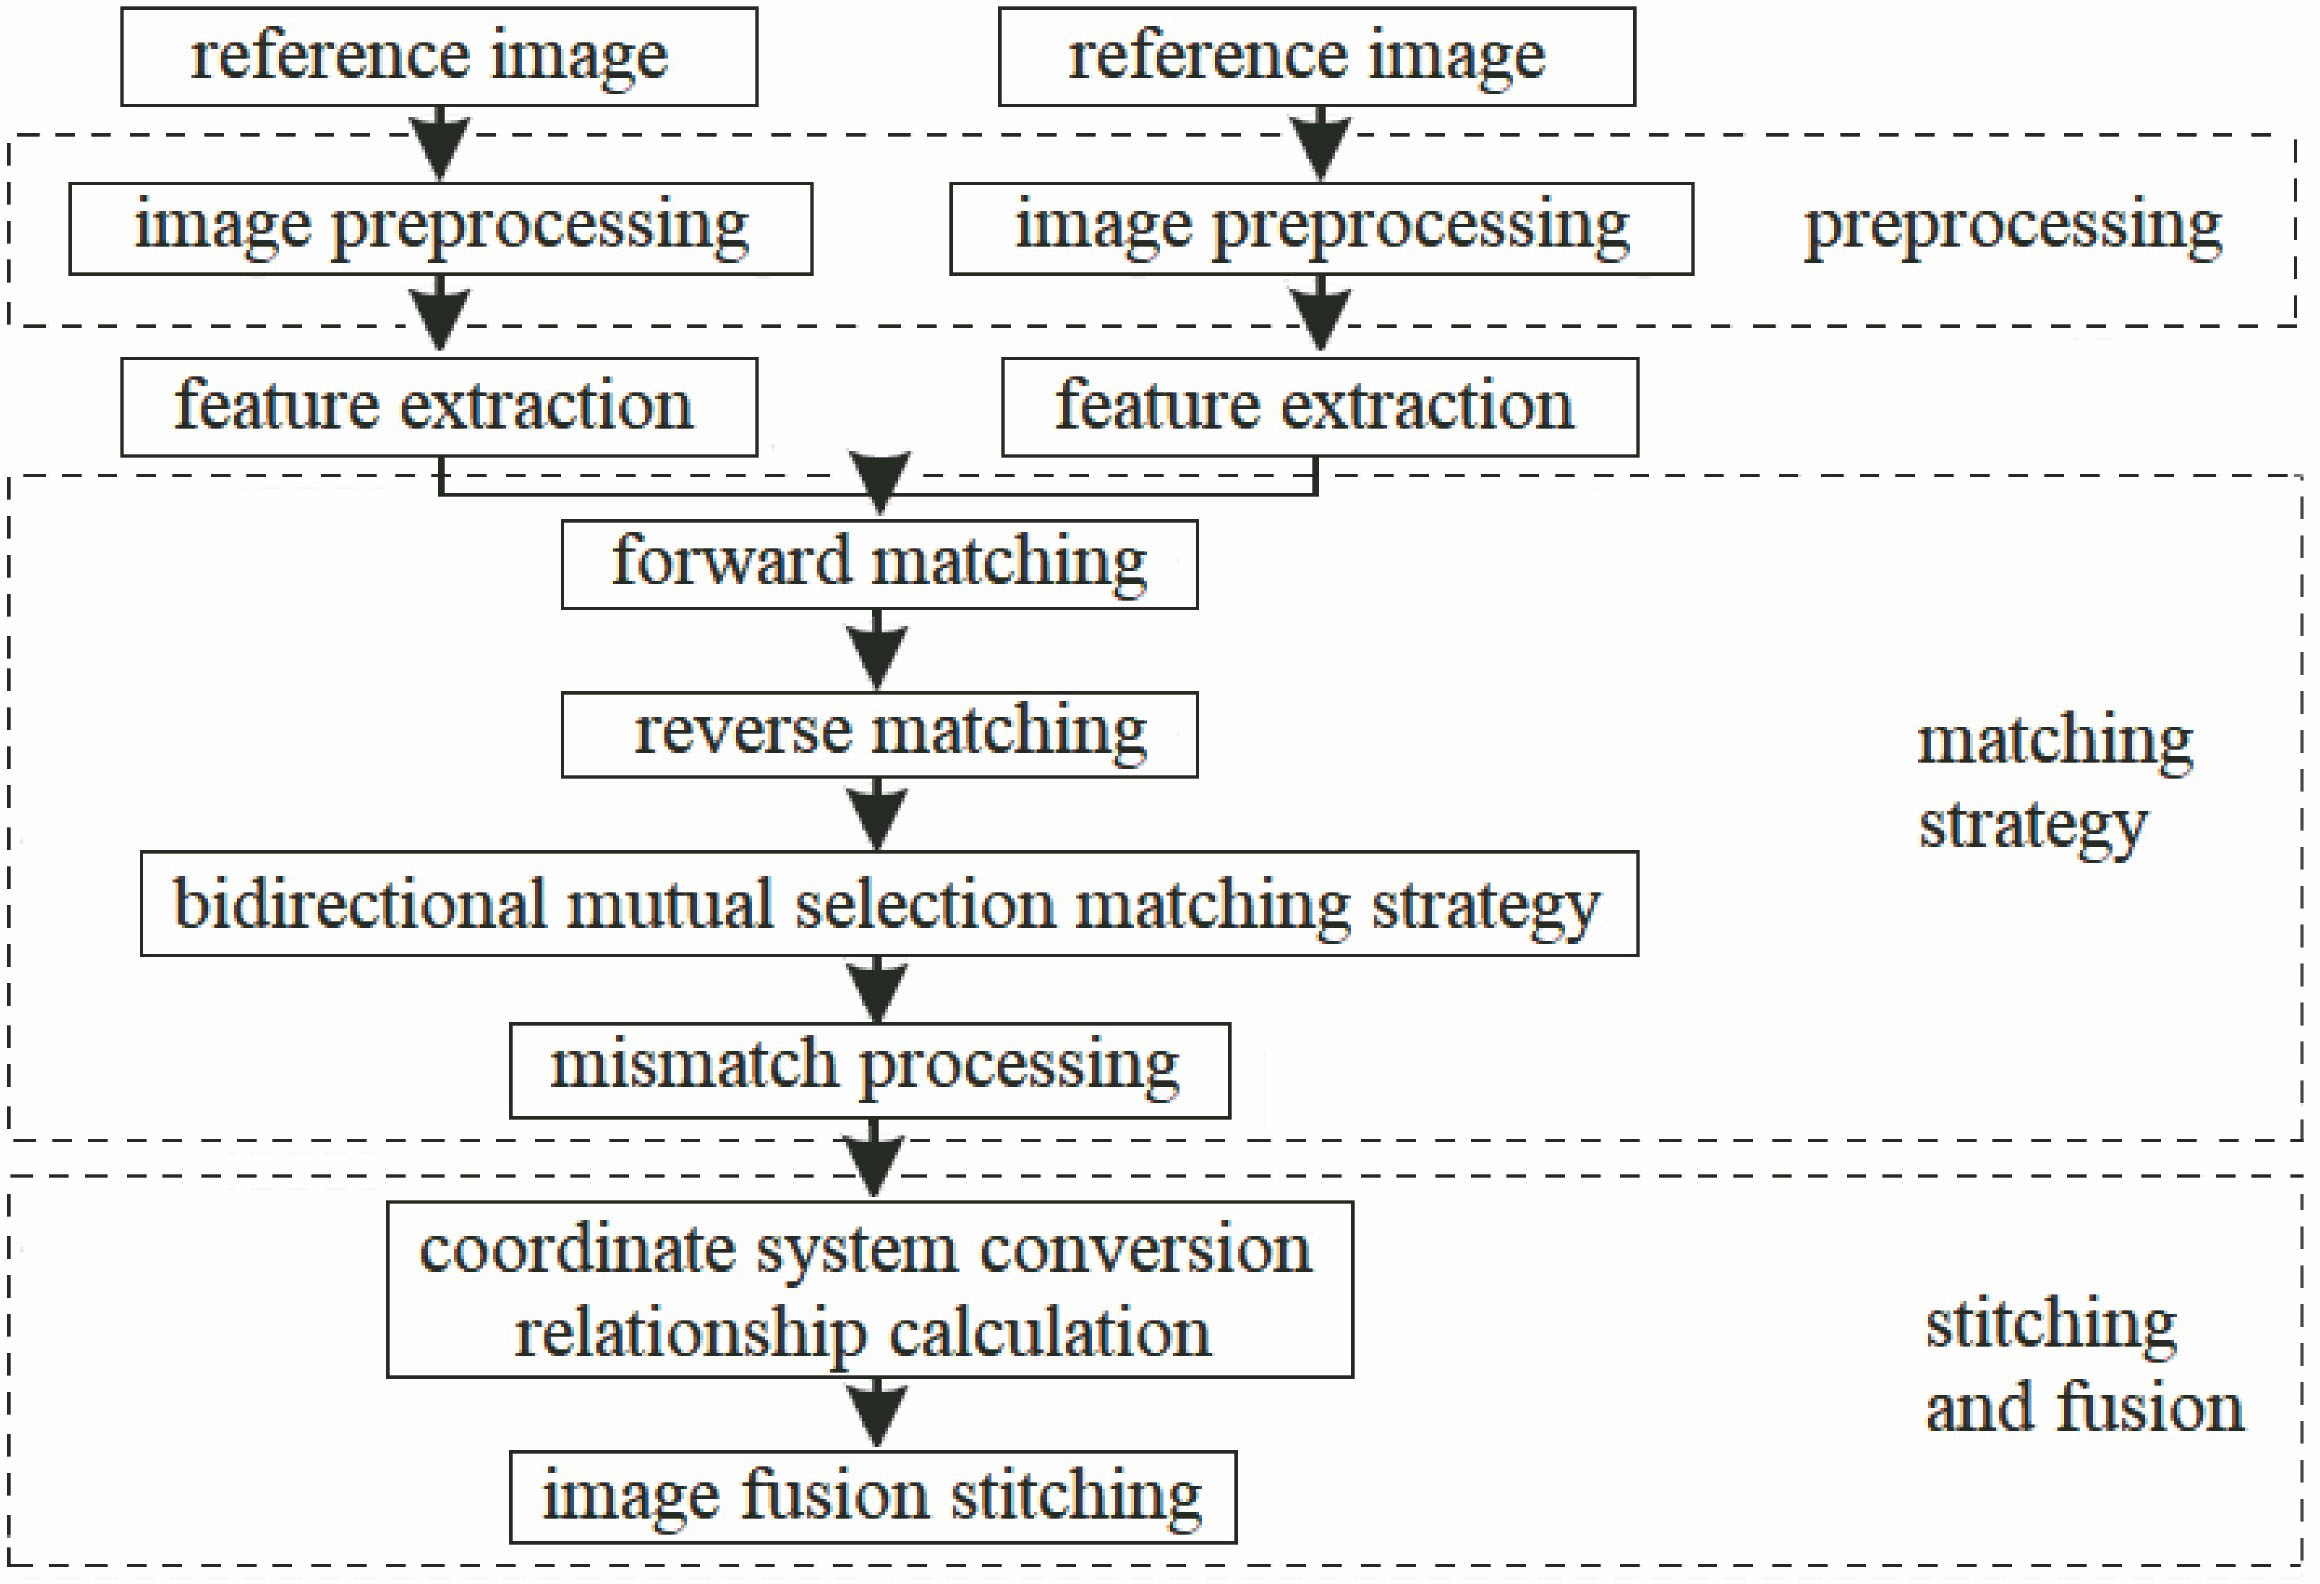
Fig. 1. Framework of proposed remote sensing image mosaic algorithm
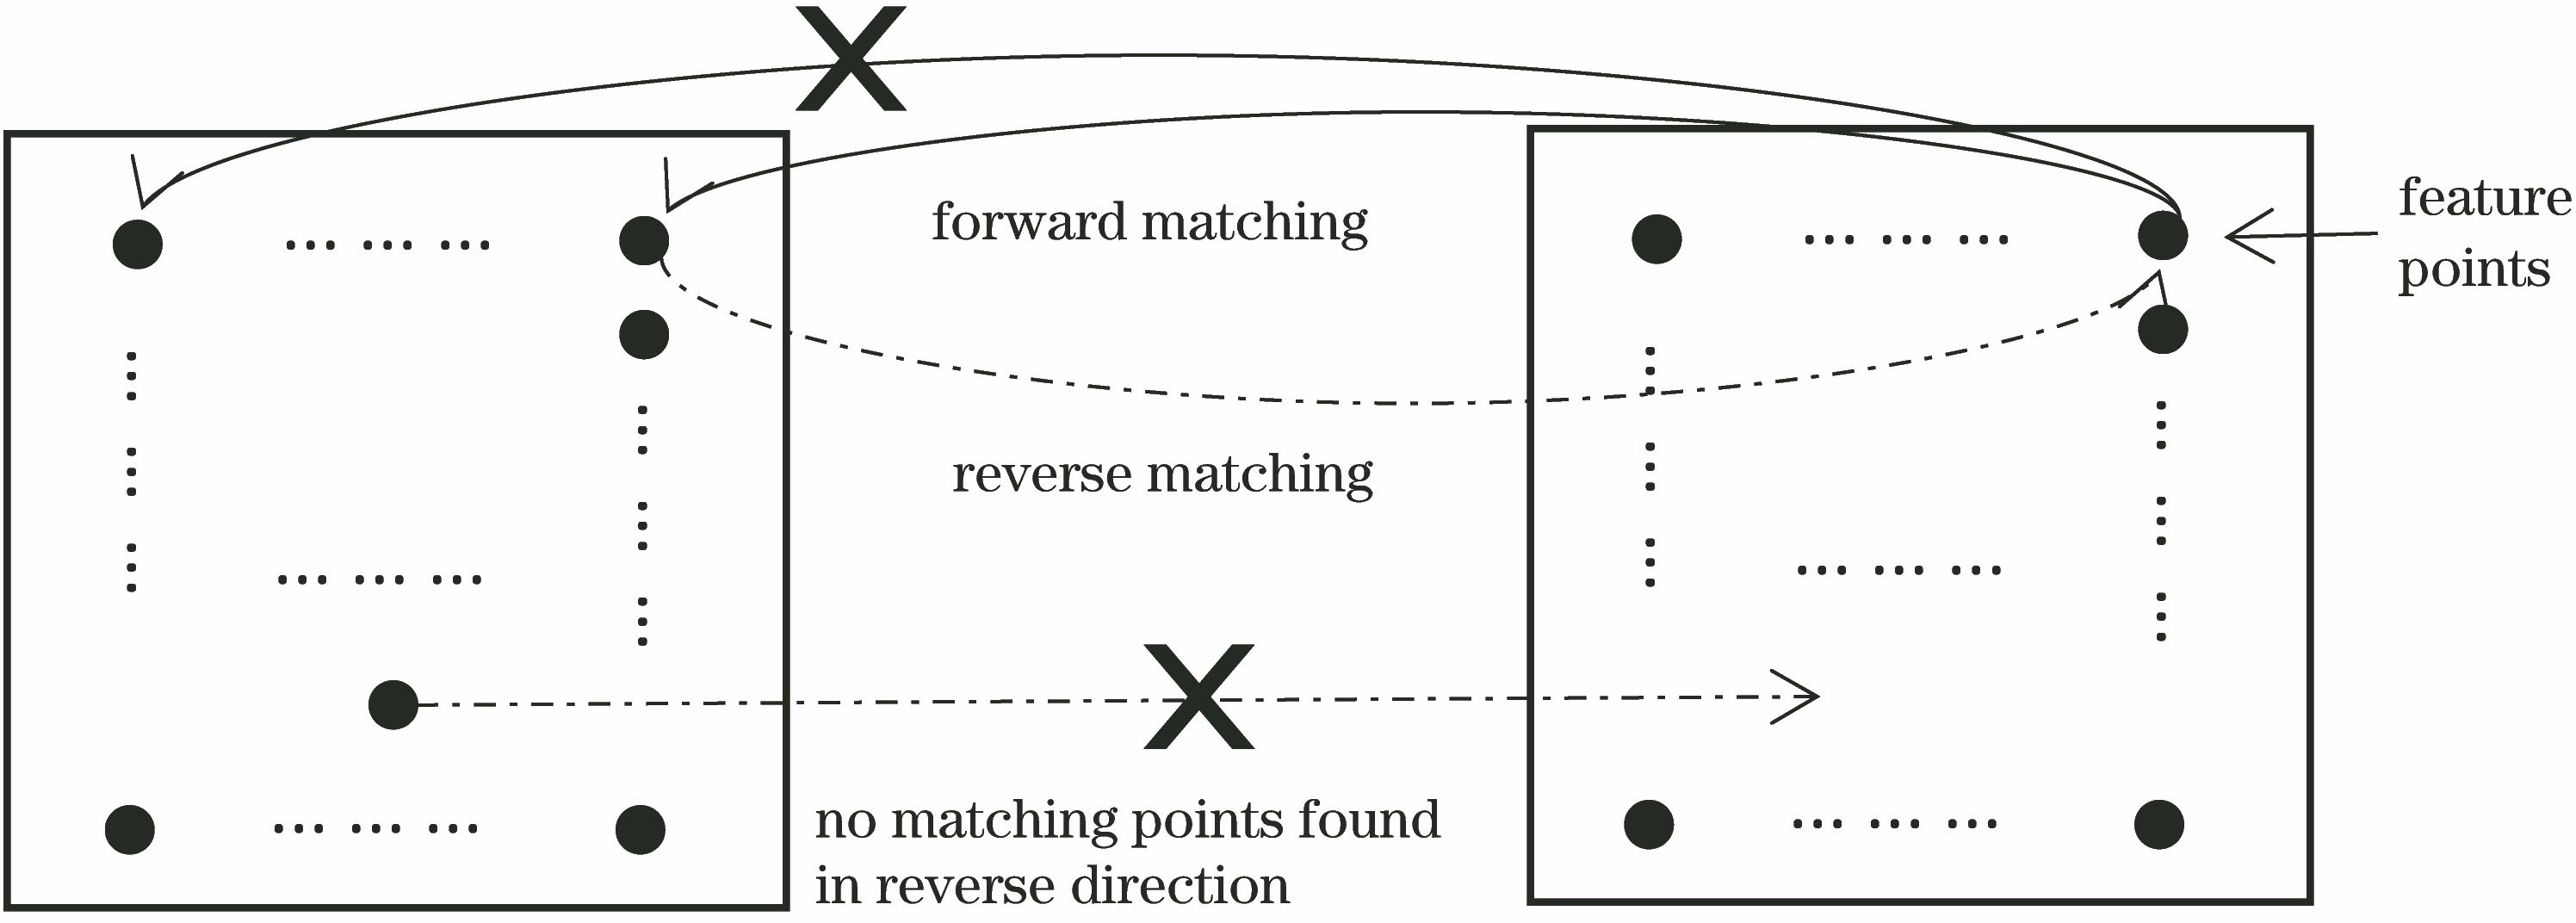
Fig. 2. Diagram of bidirectional mutual selection matching
Fig. 3. Weighted fusion process
Fig. 4. Response curve of human visual perception
Fig. 5. Plant growth function curve
Fig. 6. Function curve of weighting factor ω 1
Fig. 7. Weighted fusion process of improved S-model
Fig. 8. Preprocessing of remote sensing image. (a) Original image;(b) mean filtering; (c) guided filtering
Fig. 9. Comparison of feature point matching strategies. (a) One-way matching; (b) bidirectional mutual selection matching; (c) partial enlargement of Fig. 9 (a); (d) partial enlargement of Fig. 9 (b)
Fig. 10. Comparison of matching accuracy for images
Fig. 11. Comparison of three fusion strategies for images of industrial_area. (a)(b) Original images; (c) S-type fusion; (d) direct average fusion; (e) gradual integration
Fig. 12. Comparison of three fusion strategies for images of intersection. (a)(b) Original images; (c) S-type fusion; (d) direct average fusion; (e) gradual integration
Fig. 13. Comparison of three fusion strategies for images of harbor. (a)(b) Original images; (c) S-type fusion; (d) direct average fusion; (e) gradual integration
Fig. 14. Comparison of three fusion strategies for remote sensing images obtained from Gaofen-1 satellite with resolution of 2 m/8 m. (a)(b) Original images; (c) S-type fusion; (d) direct average fusion; (e) gradual integration
Fig. 15. Comparison of three fusion strategies for remote sensing images obtained from Gaofen-1 satellite with resolution of 16 m. (a)(b) Original images; (c) S-type fusion; (d) direct average fusion; (e) gradual integration
Fig. 16. Comparison of image information entropy data
| ||||||||||||||||||||||||||||||||||||||
Table 1. Comparison of experimental data for matching points of images
| |||||||||||||||||||
Table 2. Comparison of image average gradient data

Set citation alerts for the article
Please enter your email address
© Copyright 2018-2021 | Chinese Laser Press. All Rights Reserved 沪ICP备15018463号-20