
Linlin Qi, Xiaodan Wang, Wei Ji. Analysis on Atmospheric Transmittance Characteristics of Middle-Far Infrared Spectrum in Ocean Area[J]. Laser & Optoelectronics Progress, 2022, 59(1): 0101002
- Laser & Optoelectronics Progress
- Vol. 59, Issue 1, 0101002 (2022)
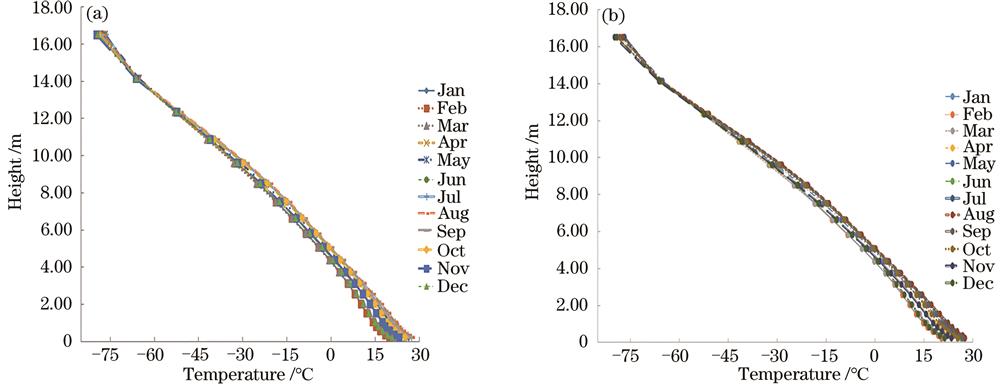
Fig. 1. Monthly averaged atmospheric temperature distribution with height. (a) 0000UTC;(b) 1200UTC
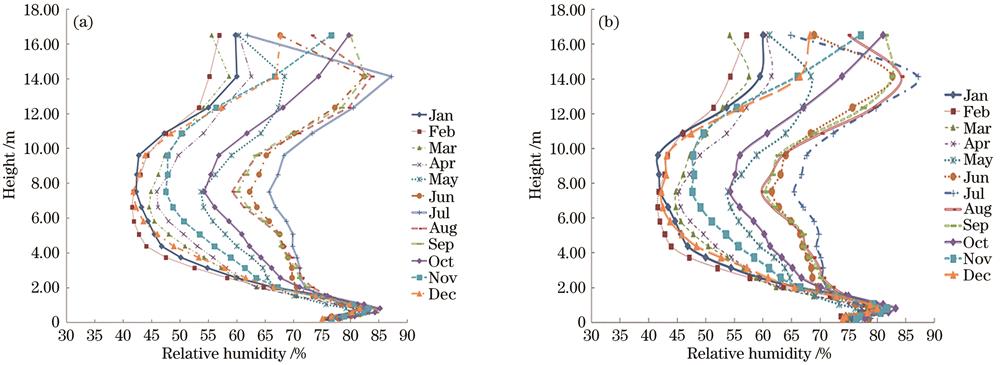
Fig. 2. Monthly averaged atmospheric humidity distribution with height. (a) 0000UTC;(b) 1200UTC
Fig. 3. Distribution at 0000UTC、1200UTC in Jan, Apr, Jul, Oct with height. (a) Atmospheric temperature; (b) atmospheric humidity
Fig. 4. Monthly distribution of transmittance of 3-5 μm under the path with height of 800 m, distance of 3000 m and pitch of 30°
Fig. 5. Monthly distribution of transmittance of 8-12 μm under the path with height of 800 m, distance of 3000 m and pitch of 30°
Fig. 6. Monthly distribution of transmittance of 3-5 μm under the path with height of 3500 m, distance of 3000 m and pitch of -50°
Fig. 7. Monthly distribution of transmittance of 8-12 μm under the path with height of 3500 m, distance of 3000 m and pitch of -50°
Fig. 8. Distribution of transmittance at 0000UTC、1200UTC in Jan, Apr, Jul, Oct of 3-5 μm、8-12 μm under the path with height of 800 m, distance of 3000 m and pitch of 30°
Fig. 9. Variation of transmittance with wavelength and height at 0000UTC in Jan.(a)3-5 μm;(b)8-12 μm
Fig. 10. Distribution of transmittance at 0000UTC in Jan, Apr, Jul, Oct of 3-5 μm、8-12 μm under the low cloud and the path with height of 1500 m, distance of 3000 m and pitch of 30°
Fig. 11. Distribution of transmittance at 0000UTC in Jan, Apr, Jul, Oct of 3-5 μm、8-12 μm under the low cloud and the path with height of 4000 m, distance of 3000 m and pitch of -50°

Set citation alerts for the article
Please enter your email address
© Copyright 2018-2021 | Chinese Laser Press. All Rights Reserved 沪ICP备15018463号-20