• Laser & Optoelectronics Progress
  • Vol. 59, Issue 8, 0817001 (2022)
Ying Zhang1, Xiaojun Wu1、*, Honghui He2, Binhua Wen1, Chengbo Liu3, and Yaguang Ren3、**
Author Affiliations
  • 1School of Mechanical and Electrical Engineering, Xi'an University of Architecture and Technology, Xi'an , Shaanxi 710055, China
  • 2Guangdong Research Center of Polarization Imaging and Measurement Engineerung Technology, Shenzhen Key Laboratory for Minimal Invasive Medical Technologies, Institute of Optical Imaging and Sensing, Shenzhen International Graduate School, Tsinghua University, Shenzhen , Guangdong 518055, China
  • 3Research Center for Biomedical Optics and Molecular Imaging, Shenzhen Institutes of Advanced Technology, Chinese Academy of Sciences, Shenzhen , Guangdong 518055, China
  • show less
    DOI: 10.3788/LOP202259.0817001 Cite this Article Set citation alerts
    Ying Zhang, Xiaojun Wu, Honghui He, Binhua Wen, Chengbo Liu, Yaguang Ren. Design and Application of Handheld Polarized Photoacoustic Computational Tomography Probe[J]. Laser & Optoelectronics Progress, 2022, 59(8): 0817001 Copy Citation Text show less
    Vector distribution diagrams of absorption coefficient of traditional isotropic absorber and absorber considering actual anisotropy. (a) Traditional isotropic absorber; (b) absorber considering actual anisotropy
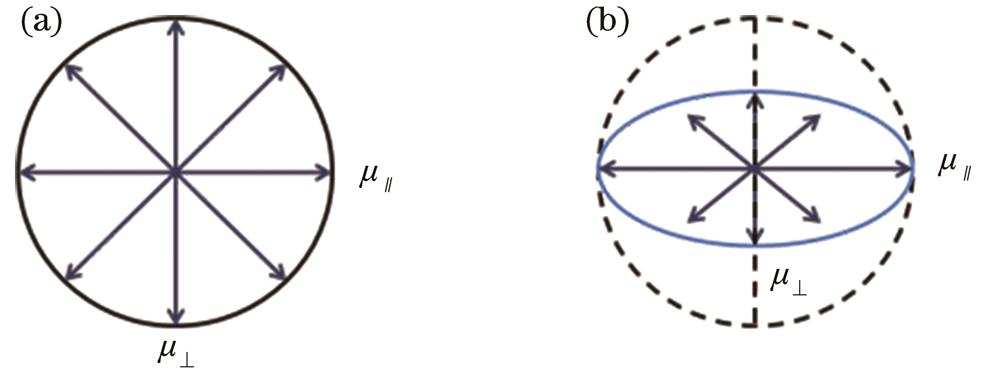
    Fig. 1. Vector distribution diagrams of absorption coefficient of traditional isotropic absorber and absorber considering actual anisotropy. (a) Traditional isotropic absorber; (b) absorber considering actual anisotropy
    Hand-held photoacoustic computed tomography probe with adjustable polarization angle. (a) Schematic diagram of each part of probe; (b) probe's optical, acoustic confocal, and spot size indication; (c) trapezoidal visual window and scale diagram; (d) physical diagram of probe structure
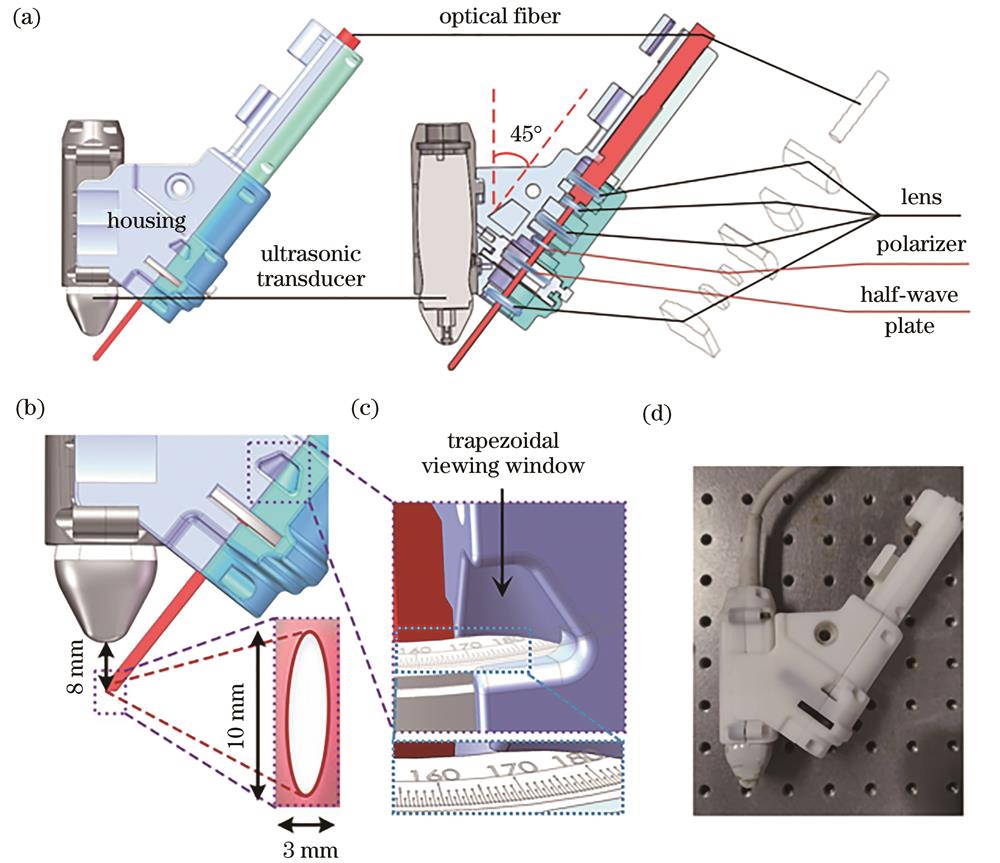
    Fig. 2. Hand-held photoacoustic computed tomography probe with adjustable polarization angle. (a) Schematic diagram of each part of probe; (b) probe's optical, acoustic confocal, and spot size indication; (c) trapezoidal visual window and scale diagram; (d) physical diagram of probe structure
    Schematic diagram of polarization PACT system
    Fig. 3. Schematic diagram of polarization PACT system
    Polarization angle calibration of probe. (a) Probe polarization angle calibration platform; (b) 0° polarized light corresponds to parameters of polarization measuring instrument; (c) schematic diagram of polarization angle of calibration; (d) picture of sample; (e) photoacoustic imaging results excited by linearly polarized light with different polarization angles ; (f) statistical values of photoacoustic signals of samples PVA and PVC in Fig. (d) varying with light polarization angle
    Fig. 4. Polarization angle calibration of probe. (a) Probe polarization angle calibration platform; (b) 0° polarized light corresponds to parameters of polarization measuring instrument; (c) schematic diagram of polarization angle of calibration; (d) picture of sample; (e) photoacoustic imaging results excited by linearly polarized light with different polarization angles ; (f) statistical values of photoacoustic signals of samples PVA and PVC in Fig. (d) varying with light polarization angle
    Results of simulated experiment. (a) Photograph of samples; (b) photoacoustic imaging results of sample (a) excited by linearly polarized light with different polarization angles; (c) statistical value of photoacoustic signal of PVA and PVC in sample (a) varing with polarization angle; (d) schematic diagram of PVA at different depths in same optical axis direction; (e) photoacoustic imaging results of PVA at different depths under different polarization angles of light excitation
    Fig. 5. Results of simulated experiment. (a) Photograph of samples; (b) photoacoustic imaging results of sample (a) excited by linearly polarized light with different polarization angles; (c) statistical value of photoacoustic signal of PVA and PVC in sample (a) varing with polarization angle; (d) schematic diagram of PVA at different depths in same optical axis direction; (e) photoacoustic imaging results of PVA at different depths under different polarization angles of light excitation
    Experimental results of biological tissues. (a) Bovine tendon imaging area and its enlarged picture; (b) photoacoustic imaging result of sample (a) excited by linearly polarized light with 0° polarization angle; (c) photoacoustic imaging result of sample (a) excited by linearly polarized light with 90° polarization angle; (d) result of photoacoustic signal subtracted from photoacoustic signal excited by the two polarization angles
    Fig. 6. Experimental results of biological tissues. (a) Bovine tendon imaging area and its enlarged picture; (b) photoacoustic imaging result of sample (a) excited by linearly polarized light with 0° polarization angle; (c) photoacoustic imaging result of sample (a) excited by linearly polarized light with 90° polarization angle; (d) result of photoacoustic signal subtracted from photoacoustic signal excited by the two polarization angles
    ParameterValue
    Polarization angle030456090120135150180
    Calibration angle341.5326.5319311.5296.5281.5274266.5251.5
    Table 1. Comparison table of probe polarization angle and calibration angle
    Ying Zhang, Xiaojun Wu, Honghui He, Binhua Wen, Chengbo Liu, Yaguang Ren. Design and Application of Handheld Polarized Photoacoustic Computational Tomography Probe[J]. Laser & Optoelectronics Progress, 2022, 59(8): 0817001
    Download Citation